

Wave Rider vs TwisterPro Scalper MT5: Modes, Tests & Risk
Wave Rider vs TwisterPro Scalper MT5: Two Modes, Different Risk Choices
Compare Wave Rider’s recovery-versus-single-position framework with TwisterPro’s Mode 1 and Mode 2 scalping profiles. Examine six historical chart/report pairs, original review videos and separately labelled forward snapshots.

Watch the Original EA Reviews
These videos explain each product’s described setup and source tests. The TwisterPro video is the v2.0 Mode 1 versus Mode 2 review, rather than the older backtest video used in some earlier comparisons. Neither video constitutes an identical-risk head-to-head experiment.
Wave Rider EA original review
TwisterPro Scalper MT5 Mode 1 vs Mode 2 review
“Two Modes” Does Not Mean the Same Thing
Wave Rider EA
The described choice is Recovery Grid versus Single Position. It changes whether adverse movement can lead to added recovery layers and a coordinated basket exit.
TwisterPro Scalper
Both reviewed v2.0 profiles retain defined Stop Loss and Take Profit without described grid expansion. Mode 2 uses a shorter stop configuration and a more active trading profile.
Why Compare Mode Design Before Headline Returns?
Wave Rider and TwisterPro automate gold trading on MetaTrader 5, yet their mode labels describe different decisions. Selecting a mode can change trade selection, stop distance, position count or the way losses develop. It is therefore more useful to compare those mechanics than the largest ending balance.
This Wave Rider vs TwisterPro Scalper MT5 comparison uses the Wave Rider EA review and TwisterPro v2.0 review. The focus is recovery exposure versus selective scalping modes. Described features are attributed to those reviews; report figures are checked against the underlying screenshots. Proprietary entry code has not been independently audited.
How Wave Rider Trades: Several Engines, Alternative Recovery
Wave Rider’s source review describes seven gold setup engines supported by H1 trend context and lower-timeframe information. The setup families include support/resistance, pullbacks, breakouts, bounces, volume conditions and momentum continuation. The optional impulse engine is described as disabled by default.
Different engines can find different opportunities, but all operate within the same gold market. Signals may cluster around one movement. Account exposure therefore depends on the active engines, lot sizes and management mode, not simply the number of strategy names.
Recovery Grid
This option may add positions after adverse movement and seek a coordinated basket exit. Recovery-profile choices alter the sequence, but cannot guarantee recovery. Added layers increase the importance of margin and total volume.
Single Position
Recovery layers are disabled and an individual trade uses Stop Loss, Take Profit and trailing protection. This is a different exposure model and requires its own test record.
The review also describes daily drawdown protection, all-time-high entry protection, dynamic exits and news controls. Their actual effect depends on enabled settings and successful order execution. Gaps, slippage or a disconnected terminal can prevent a target threshold from acting as a precise loss ceiling.
The dashboard shows fixed 0.01 lots and a “Very Low Risk–Balanced” preset label. That is a configuration name, not a certification. The complete input list and exact recovery profile are not exposed, so these historical results are not assigned to every available mode.
Wave Rider Forward-Trading Snapshot
The uploaded screenshot contains history comments identifying Wave Rider strategy rows such as S01, S04, S05 and S06. Other EAs share the account view. Their trades and account-wide totals must not be presented as standalone Wave Rider performance.

View More Forward Trading Results
How TwisterPro Trades: Selective XAUUSD M15 Scalping
TwisterPro’s reviewed v2.0 design targets XAUUSD on M15. Its product description says a setup must pass five validation layers before entry. The public review does not disclose enough detail to reproduce their equations, so those layers should not be replaced with invented indicator thresholds.
Each reviewed trade uses defined Stop Loss and Take Profit, without described grid expansion or averaging down. This differs from Wave Rider’s recovery option, but does not imply that aggregate exposure is always small or that losses cannot exceed the intended stop during adverse execution.
Mode 1
Positioned around selective entries and capital preservation. In the longer test it completed 68 trades and reported 2.95% relative equity drawdown. This is an observed sample, not a guaranteed future ceiling.
Mode 2
Uses a shorter stop configuration and a more active profile. Its longer test completed 101 trades with 17.67% relative equity drawdown. Shorter stops do not automatically mean lower account risk.
TwisterPro’s materials emphasize RAW-spread execution and stable platform uptime. For a short-term gold system, commission, spread, slippage and latency can consume a meaningful share of a small price move. Confirm the current broker’s stop-distance and volume rules rather than assuming another broker will reproduce the tester.
Mode selection should be separated from lot sizing. A mode may change entry frequency or stop distance while sizing determines capital at risk. Compare both together before interpreting the much larger compounded result of Mode 2.
TwisterPro Forward Snapshots: Preserve the Version Labels
The first uploaded snapshot visibly identifies Twister Pro v1.8 with multiple chart modules and an account report. It is older-version supporting evidence, not a verified forward record for v2.0 Mode 1 or Mode 2. The second image contains TwisterPro-labelled comments but does not establish its complete version, settings or history.


View More Forward Trading Results
Broker Execution and Smaller-Exposure Nano Testing
Spread, commission, slippage and execution can affect Wave Rider and TwisterPro Scalper. In TopTradingEAs’ specific Quantum Queen live comparison, FxPro ranked first and Tickmill second. That observation is not proof of the same ranking for either EA or every account type.
TopTradingEAs uses a cent-denominated FxPro Nano account. Where available for your region and broker entity, it can be considered for restrained live testing after demo setup checks. On a USD-cent account, $10 USD is displayed as 1,000 USC; real capital is still $10. Check gold contract size, tick value, symbol suffix, minimum volume and the EA’s fixed-lot or balance-based sizing before applying presets. Cent denomination alone does not guarantee small risk.
Demo, Nano and standard-account fills can differ. Nano results do not guarantee standard-account outcomes, and no account type removes trading losses. Tickmill is a separate broker alternative; no Nano offering is implied.
Broker links are referral links; TopTradingEAs may receive compensation. Check the applicable entity and current account conditions.
Six Historical Chart/Report Pairs
All six numerical reports show a $1,000 initial deposit and 100% history quality. Equal deposits do not standardize sizing, dates, feeds or transaction costs. Wave Rider’s visible fixed-lot setup must not be assumed equivalent to TwisterPro’s compounded runs.
| Historical sample | Net profit | Profit factor | Relative equity DD | Trades |
|---|---|---|---|---|
| Wave Rider short August run | $103.90 | 145.31 | 2.89% | 24 |
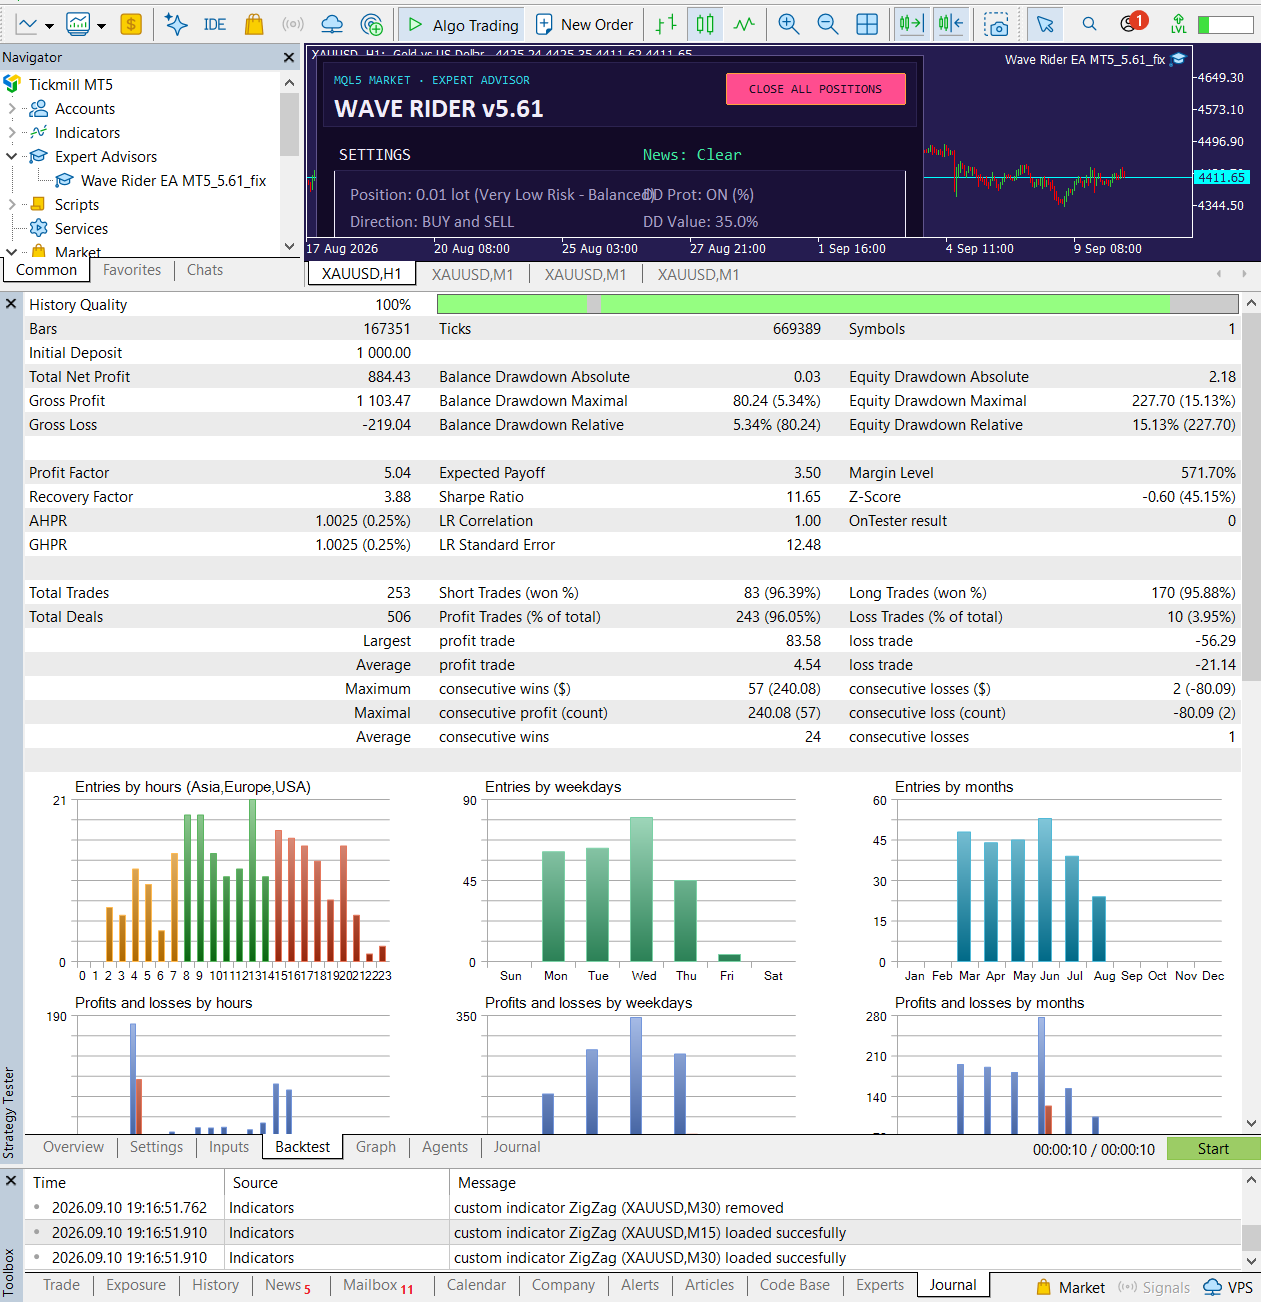
| Wave Rider longer run | $884.43 | 5.04 | 15.13% | 253 |
| TwisterPro v2.0 Mode 1 Jan–Jun | $13,802.07 | 69.74 | 2.95% | 68 |
| TwisterPro v2.0 Mode 2 Jan–Jun | $2,599,730.14 | 12.96 | 17.67% | 101 |
| TwisterPro v2.0 Mode 1 June | $423.97 | 60.97 | 0.66% | 11 |
| TwisterPro v2.0 Mode 2 June | $2,426.26 | 14.77 | 6.38% | 16 |
Drawdown consistently means Relative Equity Drawdown. For example, TwisterPro Mode 1’s longer report separately lists maximal equity drawdown of 0.66%; substituting it for the 2.95% relative figure would change the comparison.
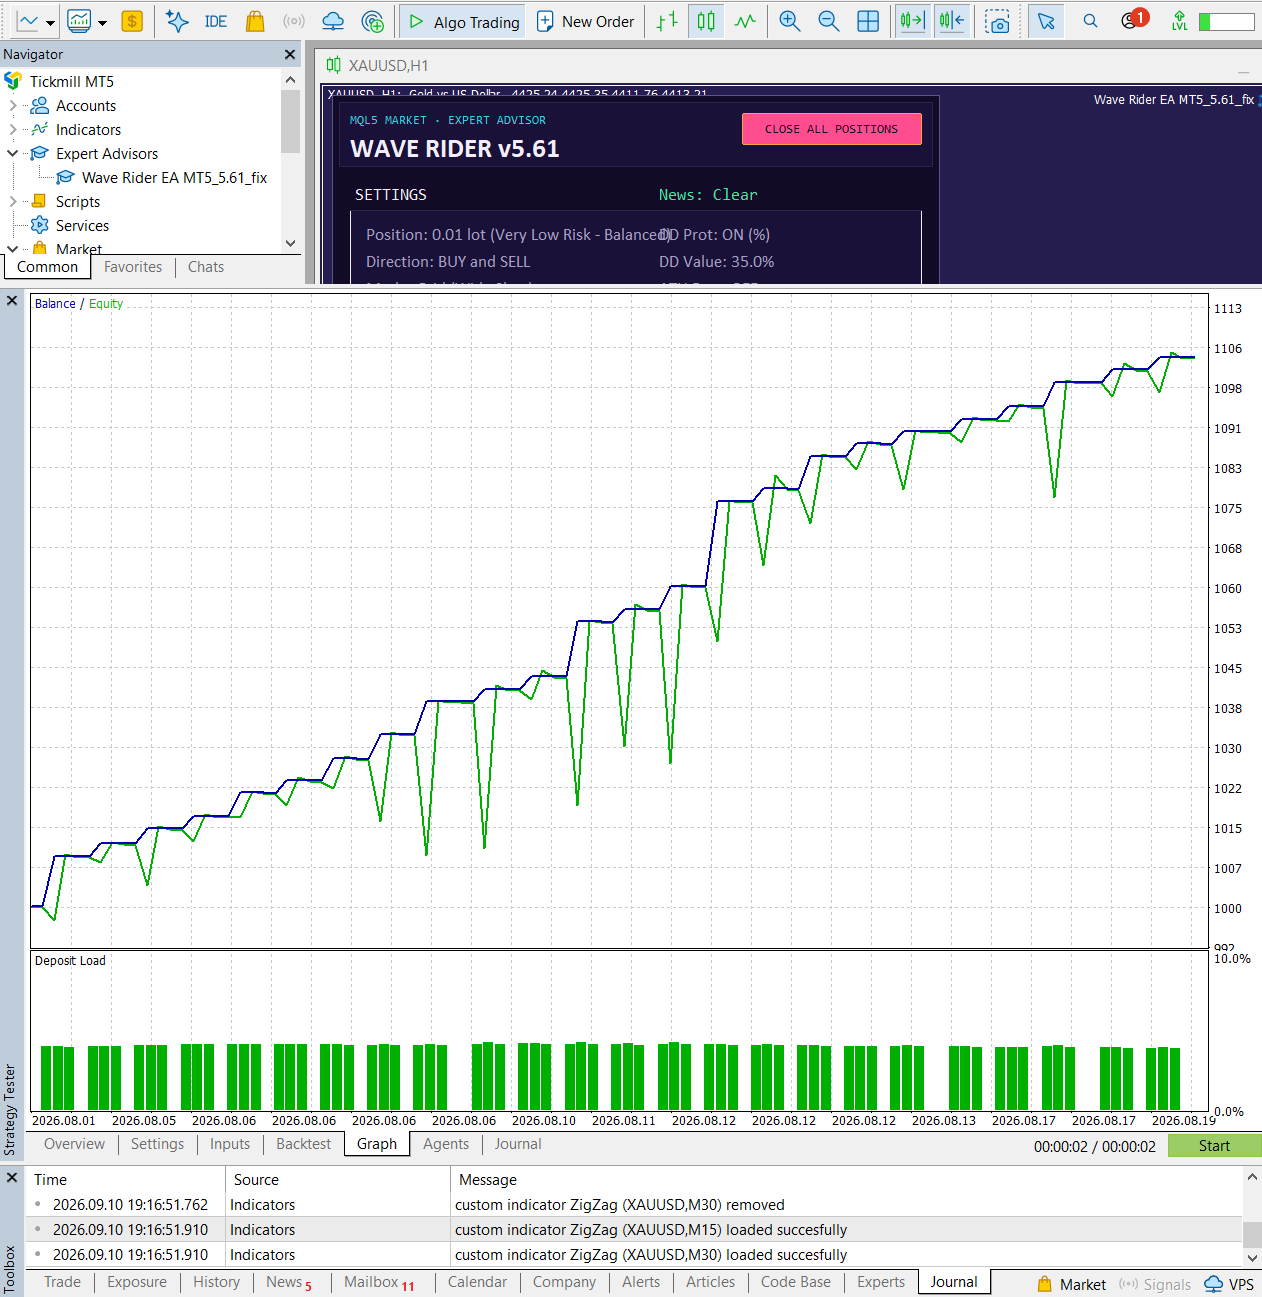
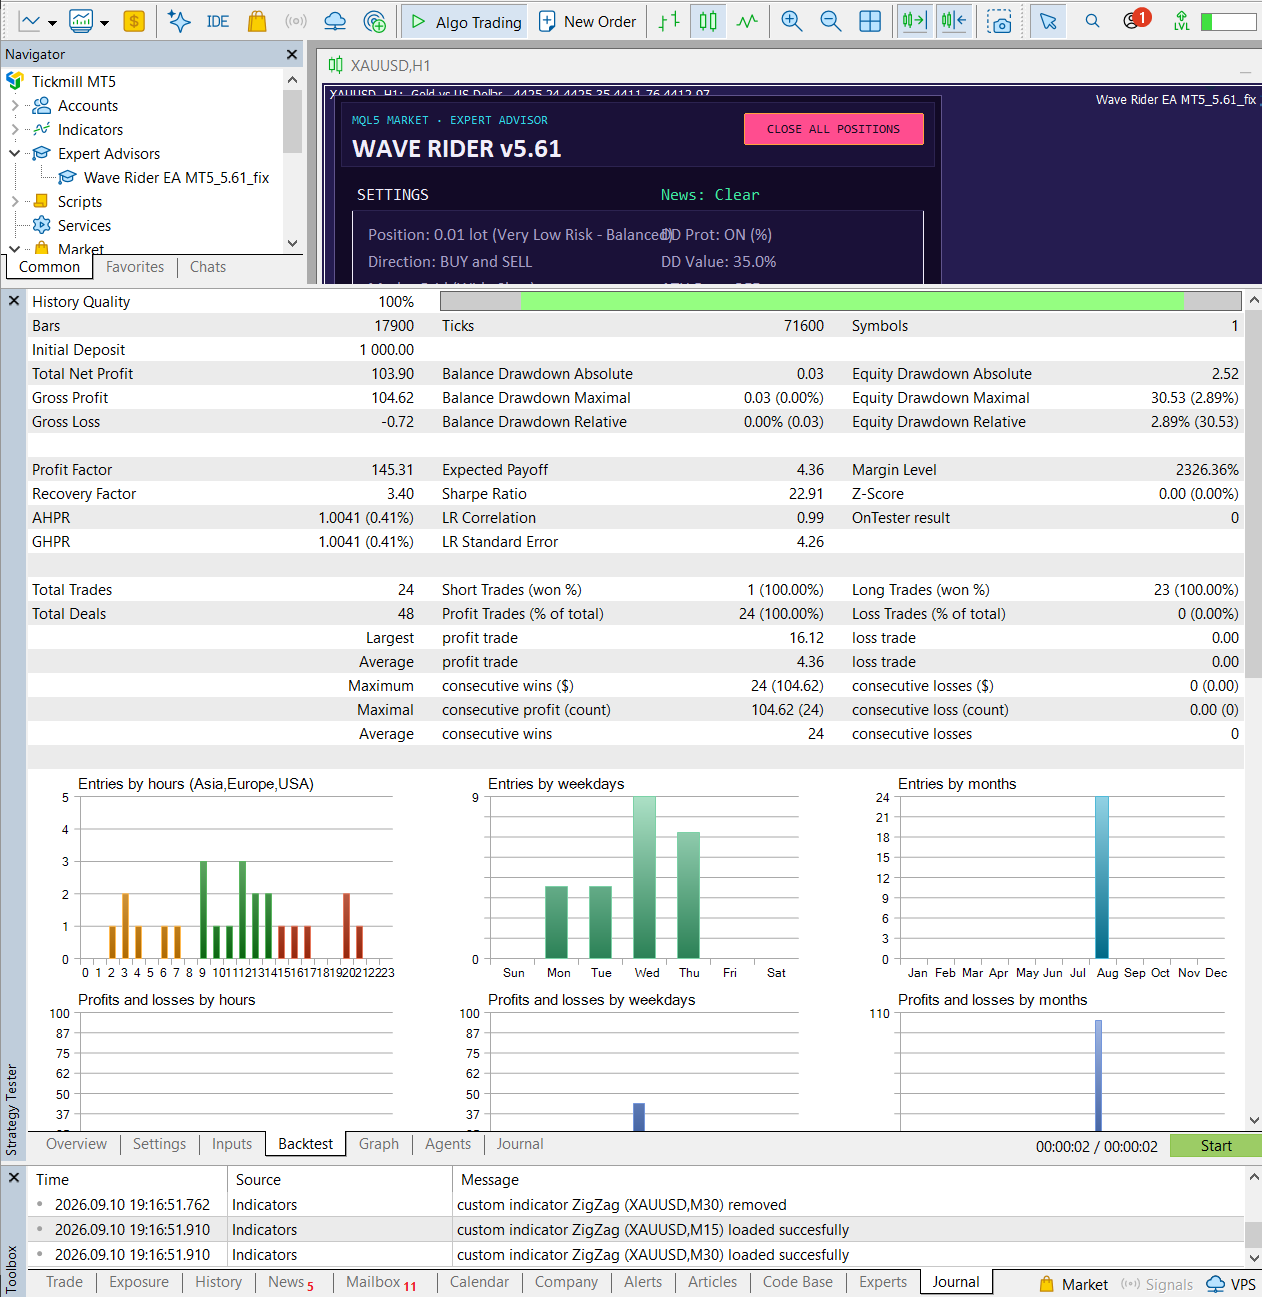
Wave Rider: Short August 2026 Sample
The chart shows August trade dates and the report contains 24 profitable trades. Profit factor 145.31 is driven by only $0.72 gross loss, making it sensitive to a few additional losing outcomes. Relative equity drawdown of 2.89% still reflects temporary floating losses.
Wave Rider: Longer Sample
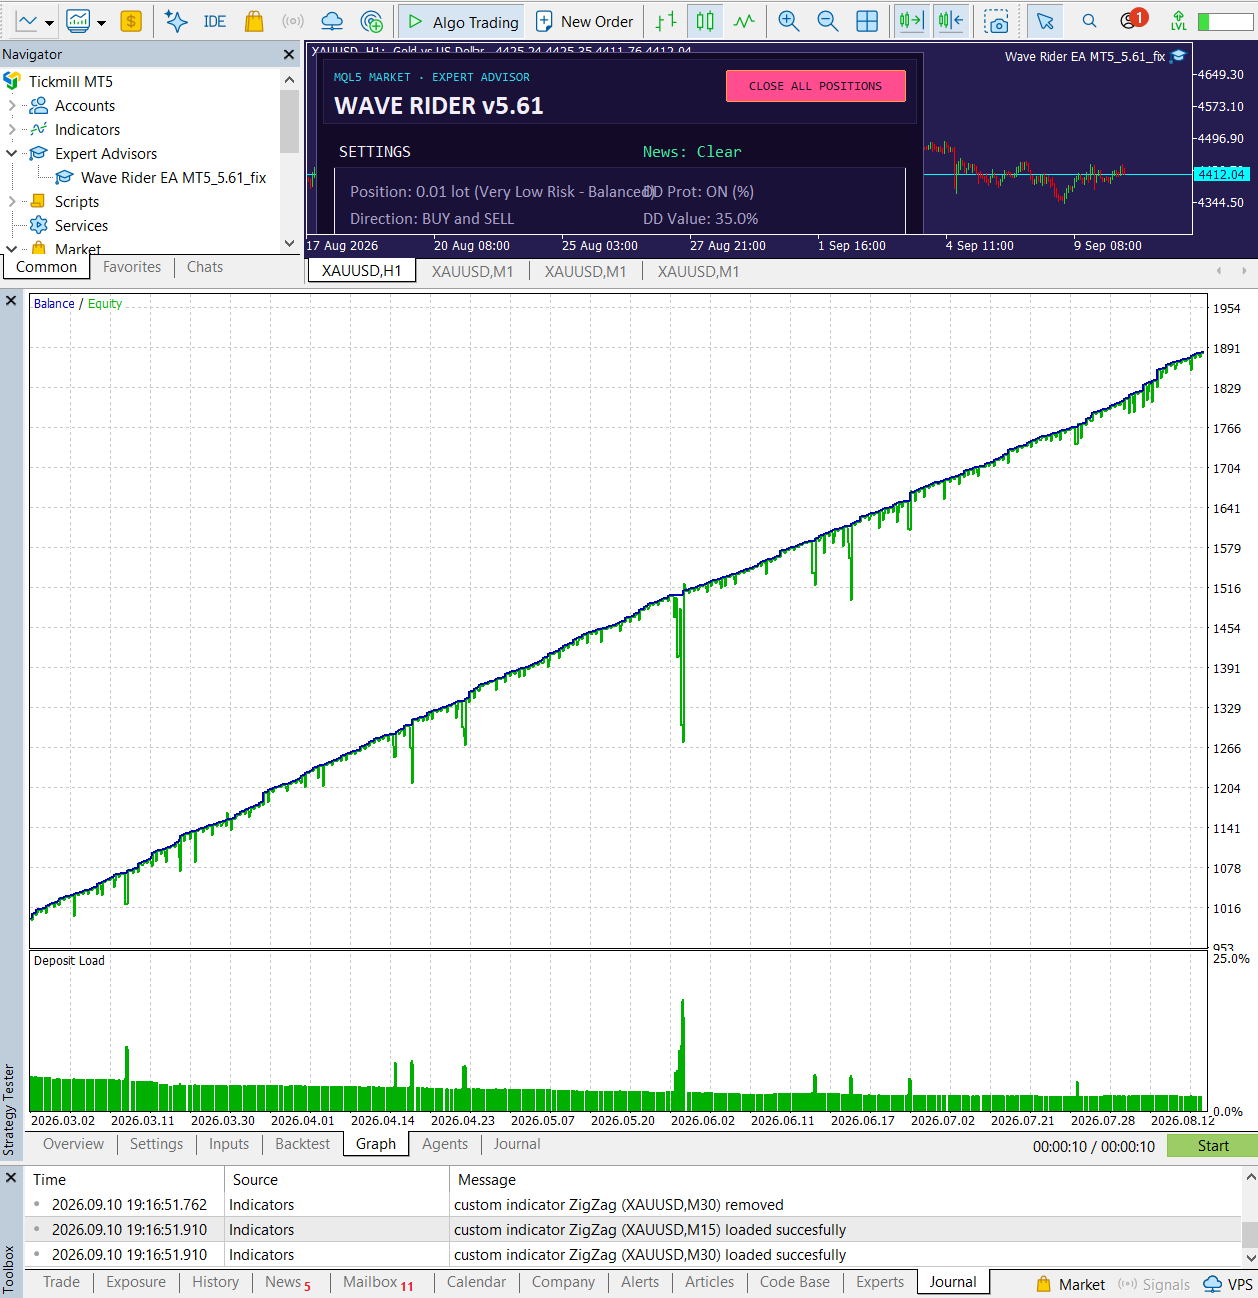
The longer chart shows March-to-August 2026 trade dates. Its report contains 253 trades, including 10 losing trades, and 15.13% relative equity drawdown. The full configured interval and every input are not visible; retain those limits when comparing it with TwisterPro’s earlier period.
TwisterPro v2.0 Mode 1: January–June 2026
The source-labelled six-month test reports 68 trades, 94.12% profitable trades and 2.95% relative equity drawdown. Its unusually high profit factor of 69.74 describes this particular loss sample, not a stable future expectation. The chart and report remain paired below.


TwisterPro v2.0 Mode 2: January–June 2026
Mode 2 reports 101 trades and 89.11% profitable trades. Relative equity drawdown rises to 17.67%, alongside much larger account growth. Its $2.6 million-scale profit is an exceptional historical outcome whose sizing and compounding must not be converted into a live return target.


TwisterPro v2.0 Mode 1: June 2026
The June report shows $423.97 net profit, 11 profitable trades and 0.66% relative equity drawdown. Eleven outcomes are a small sample. This June window overlaps the longer test, so it is not an additional independent market regime.


TwisterPro v2.0 Mode 2: June 2026
The matching June test records 16 trades, 15 profitable, and 6.38% relative equity drawdown. It preserves the mode contrast: more activity and higher drawdown than Mode 1 in that period. The sample remains too short to establish long-term loss limits.


How to Compare the Modes on Your Own Broker
Start by defining a management model and risk budget. For Wave Rider, test Recovery Grid and Single Position separately. For TwisterPro, test Mode 1 and Mode 2 while recording both sizing and stop distance. Equal lot sizes do not necessarily imply equal capital at risk.
Then hold feed, dates, starting capital, leverage and costs constant. Save the exact version and SET file. Record maximum concurrent volume, margin use, position duration, equity drawdown and losing sequences. Test spread increases and adverse fills, because precise scalping exits and recovery baskets can react differently to execution stress.
TwisterPro Mode 1’s lower displayed drawdown is worth investigating, but does not establish a universal safety winner. Wave Rider’s larger trade sample is useful context, but is not proof of better statistical independence. Judge the configuration and the quality of evidence together.
Build MT5 EAs or copy trades between accounts
BYO-Bot is Windows software for building and testing MT5 strategies without coding. Free Edition exports eligible Single Position bots using standard exits with Loss Recovery off; premium export features require a paid licence. cTrader Copier offers free MT5-to-MT5 copying and MT5-to-cTrader copying with a paid subscription.
Wave Rider vs TwisterPro Scalper MT5: FAQs
Are Wave Rider’s two modes equivalent to TwisterPro’s modes?
No. Wave Rider changes recovery-basket versus individual-position management. TwisterPro’s reviewed v2.0 modes change its selective scalping profile, including the shorter-stop Mode 2 configuration.
Does TwisterPro use a recovery grid?
The reviewed product description excludes grid expansion and describes defined Stop Loss and Take Profit. This is a source-described design, not an independent code audit or guarantee against execution losses.
Which EA has lower historical drawdown?
It depends on the sample and mode. The table retains relative equity drawdown for each report. Different dates, sizing and feeds prevent those figures from establishing one universal ranking.
Do the forward screenshots verify v2.0 live performance?
No. One TwisterPro image explicitly shows v1.8; the other does not establish its full configuration. Both are selected snapshots, not an independently verified complete v2.0 track record.
Related Gold EA Comparisons
Read the original Wave Rider review and TwisterPro Mode 1 vs Mode 2 review for their source detail. Continue with Wave Rider vs Gold Snap and MoonDog vs TwisterPro to explore other exit and entry designs without merging their evidence.
Final Verdict: Choose a Mode You Can Reproduce
The main distinction is structural: Wave Rider offers recovery or single-position management, while TwisterPro offers two selective scalping profiles without described grid expansion. A shared “two modes” label should not hide those different exposure choices.
Use the existing reports to choose questions for a reproducible demo test. The useful outcome is a configuration whose sizing, adverse-move response and execution requirements you understand, rather than a promise based on the largest historical balance.
Explore Wave Rider and TwisterPro
Review current specifications and setup resources before choosing a demo-testing configuration.
Risk Disclaimer
Gold, forex and CFDs involve substantial risk. Backtests are historical simulations; forward screenshots are selected observations, not audited performance. Costs, slippage, leverage, feeds, settings, execution and connectivity can materially alter results. Recovery exposure and simultaneous gold positions can magnify losses. Demo-test first and risk only capital you can afford to lose. This article is educational information, not financial advice.