

TwisterPro vs Nexorion EA MT5: Modes & Floating Loss
TwisterPro Scalper vs Nexorion Initium Novum EA MT5: Defined Stops, Selectivity and Floating Drawdown
Compare selective M15 TwisterPro modes with Nexorion’s H1 liquidity framework. Six original chart/report pairs, both review videos and separately labelled forward snapshots show why defined stops and profitable closures need configuration-level verification.

Watch Both Original EA Reviews
The original videos explain the reviewed versions and source test records. They are separate demonstrations, not an equal-risk head-to-head experiment. Follow the configuration labels in each report rather than treating the product name as one unchanging strategy.
TwisterPro Scalper original review
Nexorion Initium Novum EA original review
Defined Stops, Selectivity and Floating Drawdown
TwisterPro Scalper
Selective M15 scalping, defined SL/TP and two distinct v2.0 mode profiles.
Longer Mode 1: 68 trades, 2.95% relative equity DD; Mode 2: 101 trades, 17.67%.
Nexorion Initium Novum EA
H1 liquidity-and-equilibrium analysis with source-described deterministic stop protection.
146 profitable closures alongside 59.34% relative equity drawdown in January–June 2026.
What This TwisterPro Scalper vs Nexorion Initium Novum EA Comparison Examines
This TwisterPro Scalper vs Nexorion Initium Novum EA MT5 comparison focuses on defined stops, selectivity and floating drawdown. It reuses the TwisterPro Scalper source review and Nexorion Initium Novum EA source review, with original chart/report pairs and attributable forward snapshots. Product descriptions are source claims, not independent audits of proprietary code.
The reports use their own dates, settings and sizing. Common initial deposits do not standardize exposure, leverage or execution costs. Historical account growth is not an expected live return, and an attractive profit factor is not a verified maximum loss.
How TwisterPro Trades: Selective XAUUSD M15 Scalping
TwisterPro’s reviewed v2.0 design targets XAUUSD on M15. Its product description says a setup must pass five validation layers before entry. The public review does not disclose enough detail to reproduce their equations, so those layers should not be replaced with invented indicator thresholds.
Each reviewed trade uses defined Stop Loss and Take Profit, without described grid expansion or averaging down. This does not imply that aggregate exposure is always small or that losses cannot exceed the intended stop during adverse execution.
Mode 1
Positioned around selective entries and capital preservation. In the longer test it completed 68 trades and reported 2.95% relative equity drawdown. This is an observed sample, not a guaranteed future ceiling.
Mode 2
Uses a shorter stop configuration and a more active profile. Its longer test completed 101 trades with 17.67% relative equity drawdown. Shorter stops do not automatically mean lower account risk.
TwisterPro’s materials emphasize RAW-spread execution and stable platform uptime. For a short-term gold system, commission, spread, slippage and latency can consume a meaningful share of a small price move. Confirm the current broker’s stop-distance and volume rules rather than assuming another broker will reproduce the tester.
Mode selection should be separated from lot sizing. A mode may change entry frequency or stop distance while sizing determines capital at risk. Compare both together before interpreting the much larger compounded result of Mode 2.
TwisterPro Forward Snapshots: Preserve the Version Labels
The first uploaded snapshot visibly identifies Twister Pro v1.8 with multiple chart modules and an account report. It is older-version supporting evidence, not a verified forward record for v2.0 Mode 1 or Mode 2. The second image contains TwisterPro-labelled comments but does not establish its complete version, settings or history.


Nexorion Strategy: Liquidity, Equilibrium and Deterministic Entries
Nexorion’s reviewed design targets XAUUSD/gold on H1. The description combines buy-side and sell-side liquidity tracking, equilibrium calculations, premium/discount classification and mathematical trade validation. Vector-phase resonance is another named component, but the public source does not provide enough detail to reconstruct its equations.
Visual chart mapping shows the algorithm’s selected structures. It may help explain what the system is monitoring, but it does not independently establish an institutional edge or future predictive accuracy.
Source-described protection
The review states that each position receives deterministic Stop Loss protection and excludes grid expansion, averaging and martingale. Confirm that description against the installed version and preset rather than assuming every build behaves identically.
Observed equity behaviour
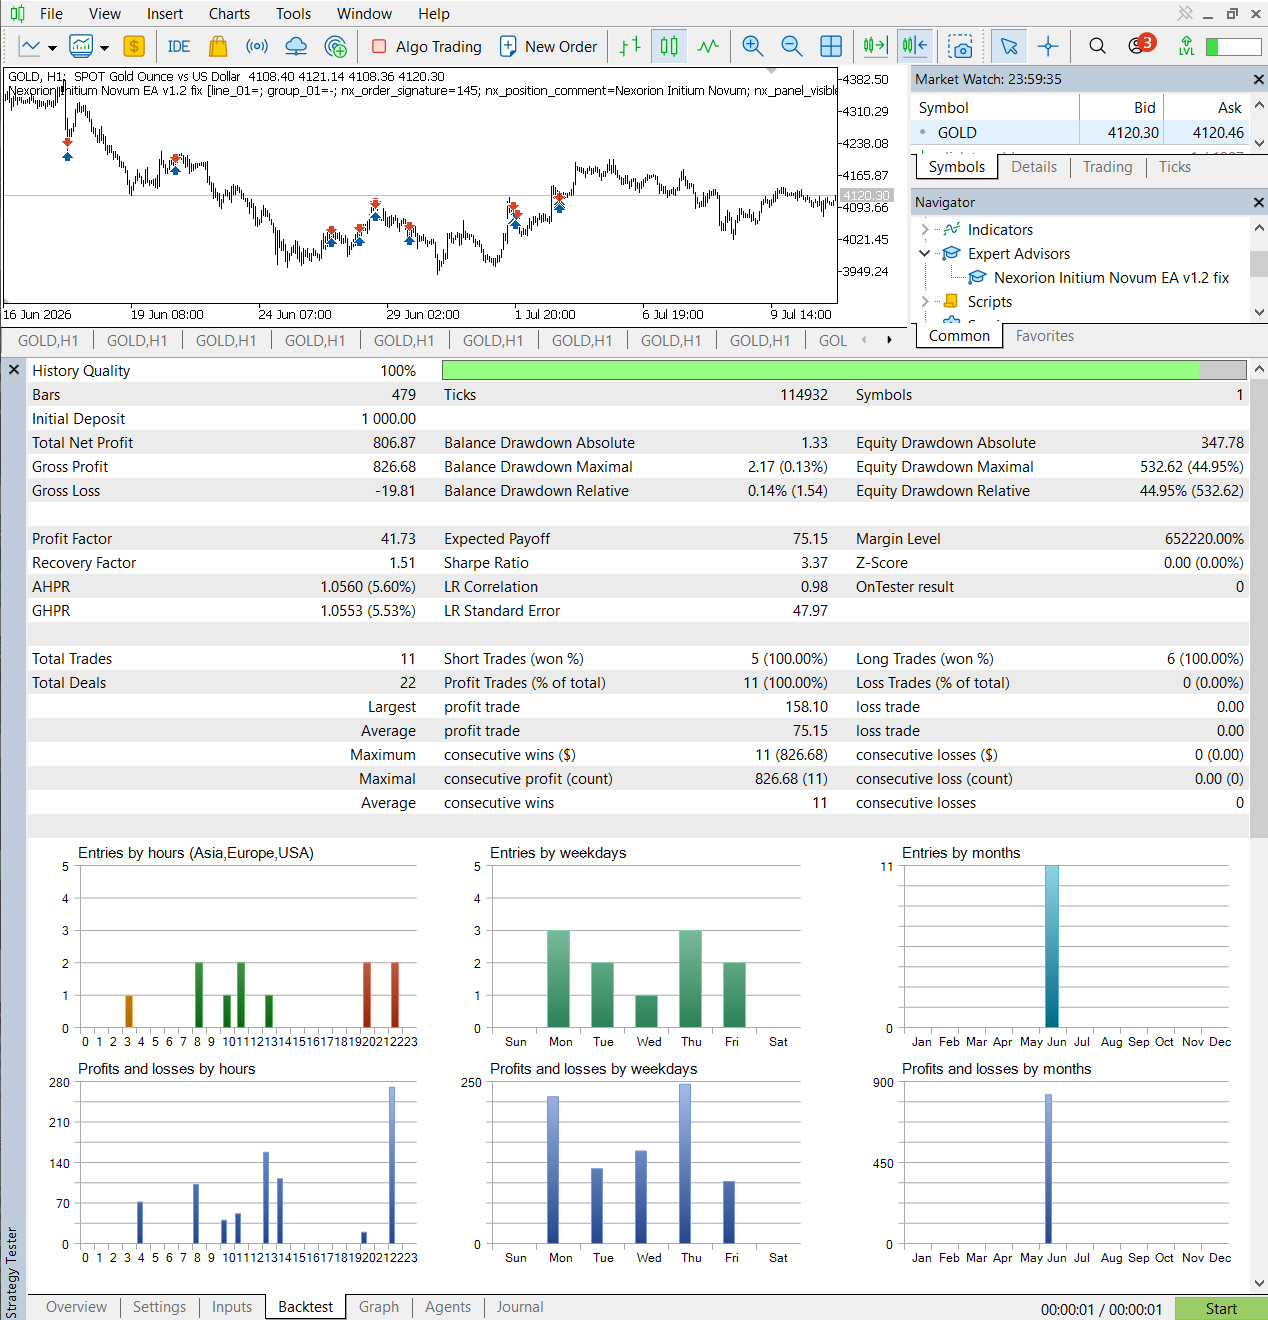
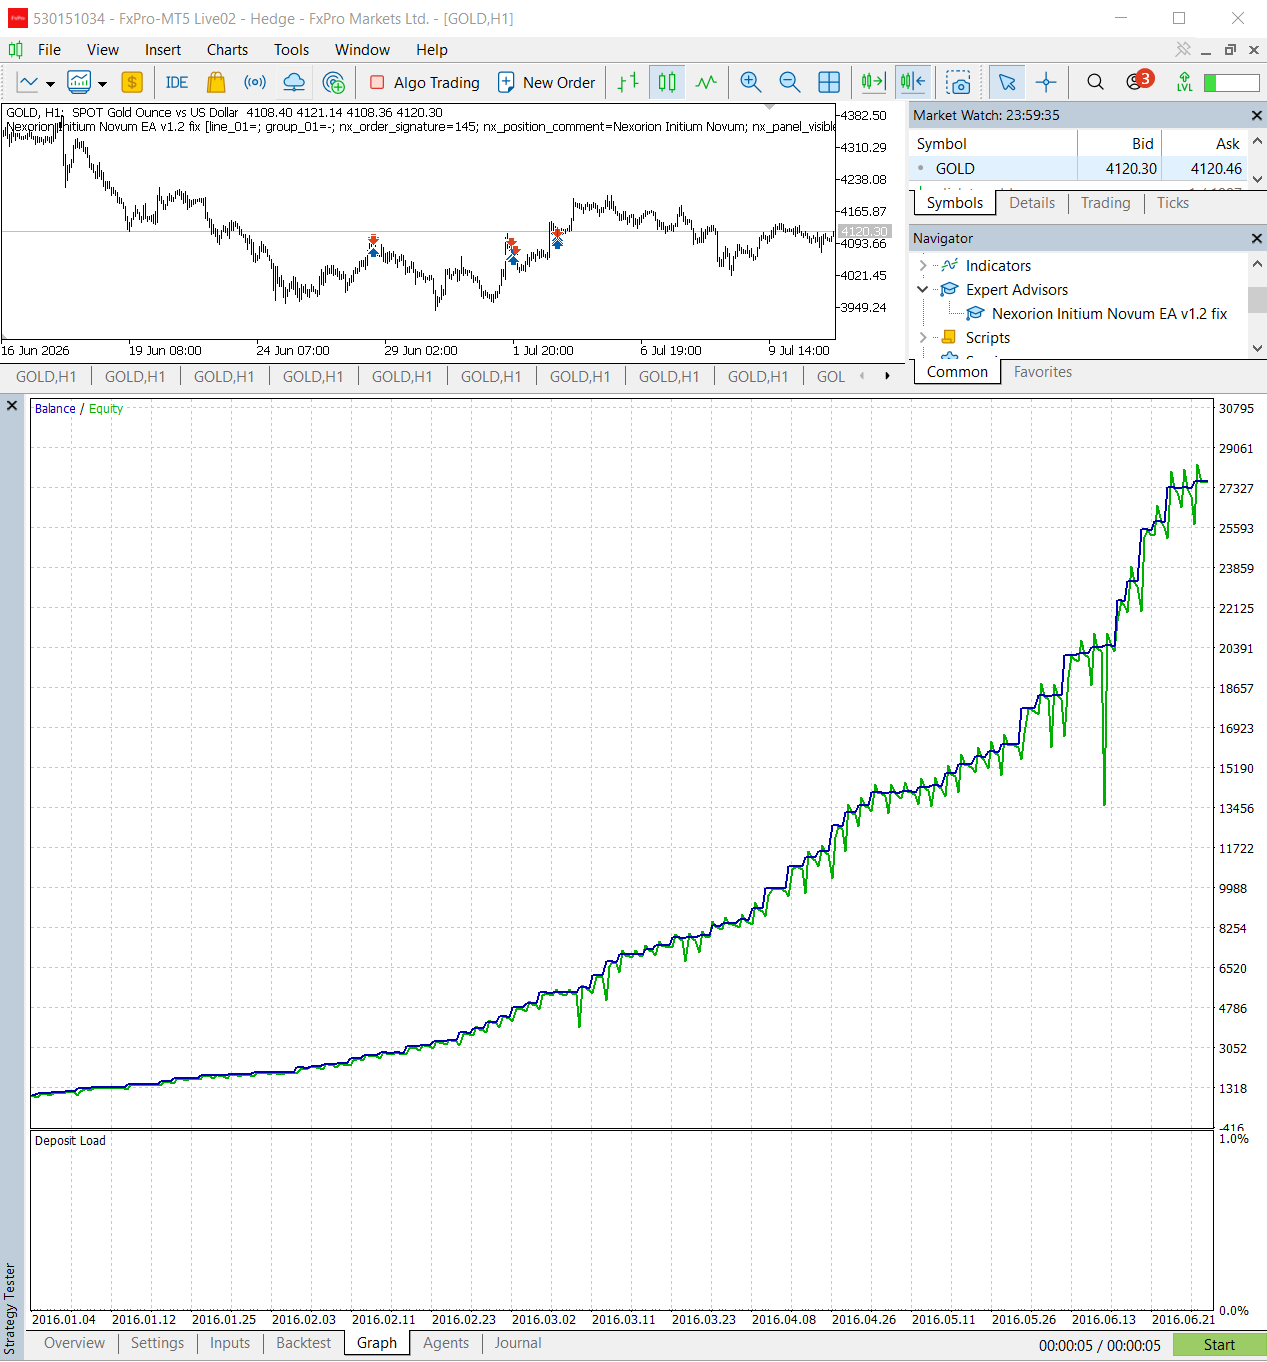
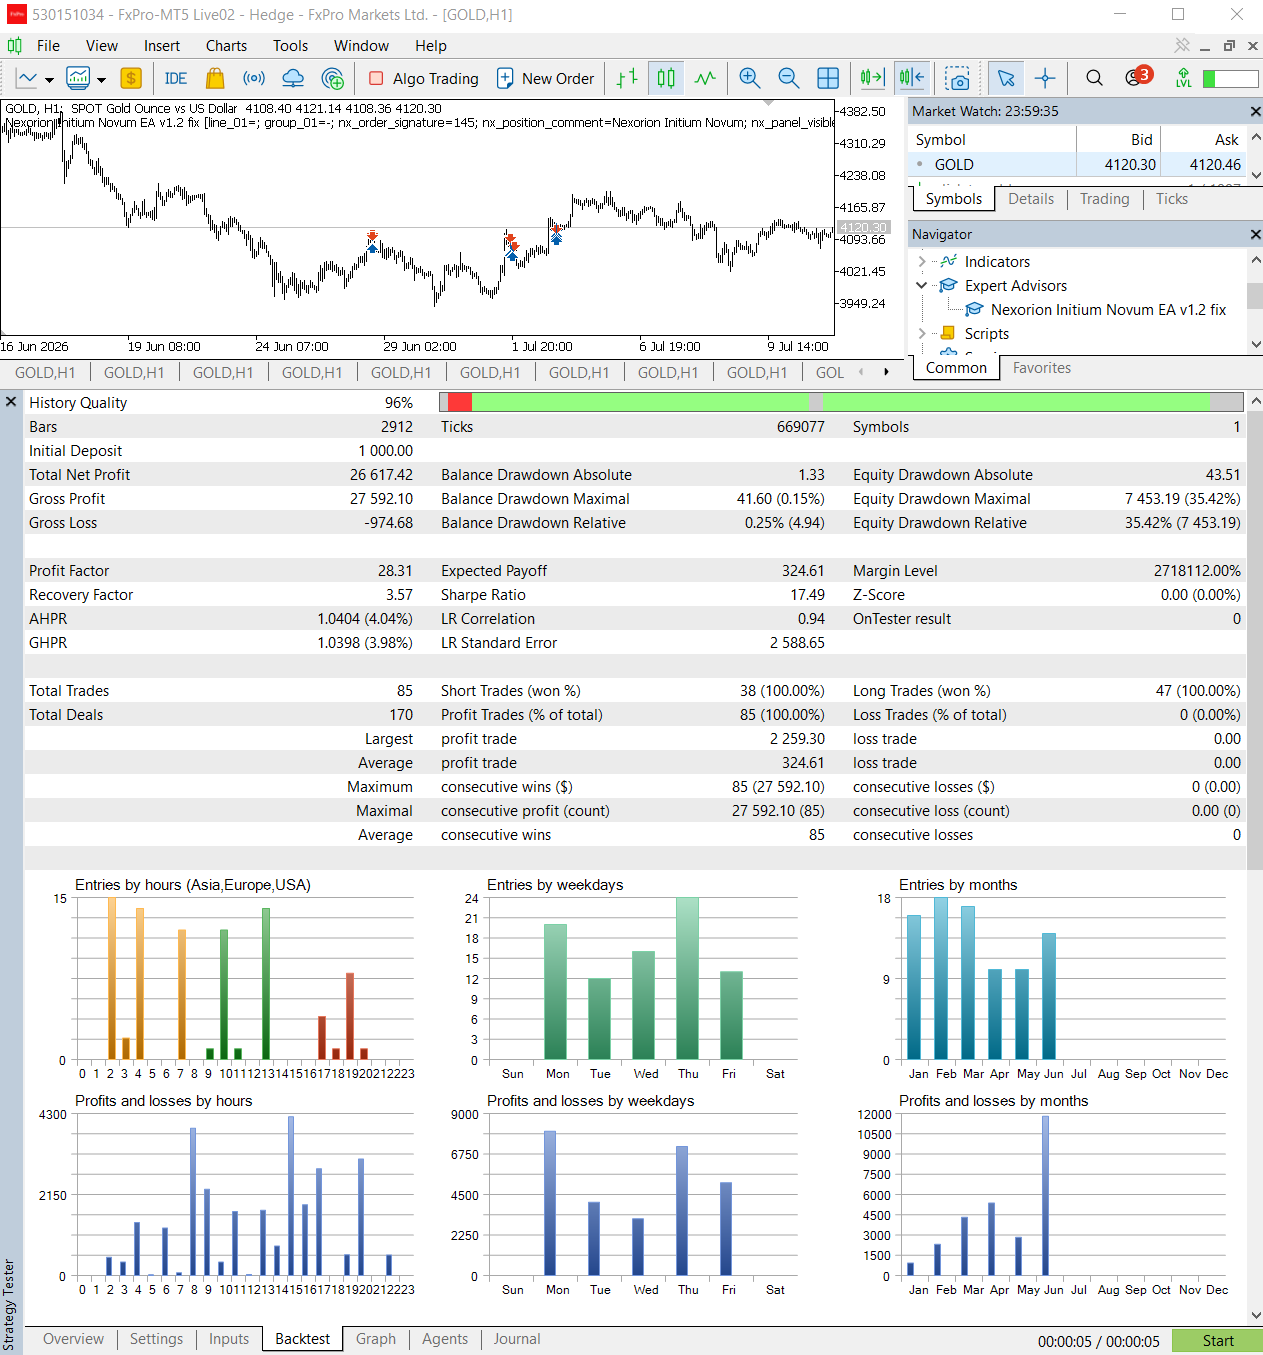
All completed trades in the three reports are profitable, while relative equity drawdown reaches 35.42%, 44.95% and 59.34%. Profitable closure and low floating risk are different properties.
Those reports do not establish why every closure was positive, exactly how stops evolve or the full sizing rules. Investigate exposure duration, changing lot sizes and the response when liquidity analysis fails. Defined stops remain subject to gaps, slippage, order rejection and platform conditions.
For a no-grid gold EA comparison, the distinction is practical: excluding recovery layers removes one source of expanding exposure, but position size, stop distance and holding behaviour can still create substantial account fluctuations.
Nexorion Forward-Trading Snapshot
The uploaded snapshot contains Nexorion-labelled history rows alongside other EAs. Only those labelled rows can be attributed to Nexorion; the account balance, equity and other dashboard totals are not Nexorion-only performance. Account type, completeness and independent verification are not established.

Recommended Brokers and Smaller-Exposure Nano Testing
Spread, commission, slippage and execution can materially affect active gold strategies. In TopTradingEAs’ specific Quantum Queen live comparison, FxPro ranked first and Tickmill second. That experience makes them candidates to investigate, not proof of the same ranking for TwisterPro Scalper or Nexorion Initium Novum EA.
For initial small-exposure live testing, consider an eligible FxPro Nano account. TopTradingEAs uses this cent-denominated account; the FxPro account email describes cent-sized exposure and real execution. For a USD-cent balance, $10 USD appears as 1,000 USC—it is still $10 of capital. Confirm regional availability, gold contract size, minimum volume and the EA’s sizing behaviour before using presets. A numeric 1,000 USC balance is not equivalent to a $1,000 standard-account risk budget.
Demo testing remains useful for setup checks, but its fills can differ from live execution. Nano results also do not guarantee standard-account outcomes. Compare actual costs and equity risk before increasing exposure.
Broker links are referral links; TopTradingEAs may receive compensation. Check the applicable entity and account conditions before opening an account.
Historical MT5 Evidence: 6 Separate Chart and Report Pairs
Each historical chart is followed by its matching numerical report. Use Relative Equity Drawdown consistently; balance drawdown and maximal-equity percentages are different fields. Short June or August samples can overlap the longer record, so they are not independent extra market regimes.
Most reports show 100% history quality; Nexorion’s 2016 report shows 96% where included. This is a tester data-quality field, not verification of broker fills. Complete risk inputs, dynamic sizing and all execution assumptions are not standardized across the products.
TwisterPro v2.0 Mode 1: January–June 2026
The source-labelled six-month test reports 68 trades, 94.12% profitable trades and 2.95% relative equity drawdown. Its unusually high profit factor of 69.74 describes this particular loss sample, not a stable future expectation. The chart and report remain paired below.


TwisterPro v2.0 Mode 2: January–June 2026
Mode 2 reports 101 trades and 89.11% profitable trades. Relative equity drawdown rises to 17.67%, alongside much larger account growth. Its $2.6 million-scale profit is an exceptional historical outcome whose sizing and compounding must not be converted into a live return target.


TwisterPro v2.0 Mode 1: June 2026
The June report shows $423.97 net profit, 11 profitable trades and 0.66% relative equity drawdown. Eleven outcomes are a small sample. This June window overlaps the longer test, so it is not an additional independent market regime.


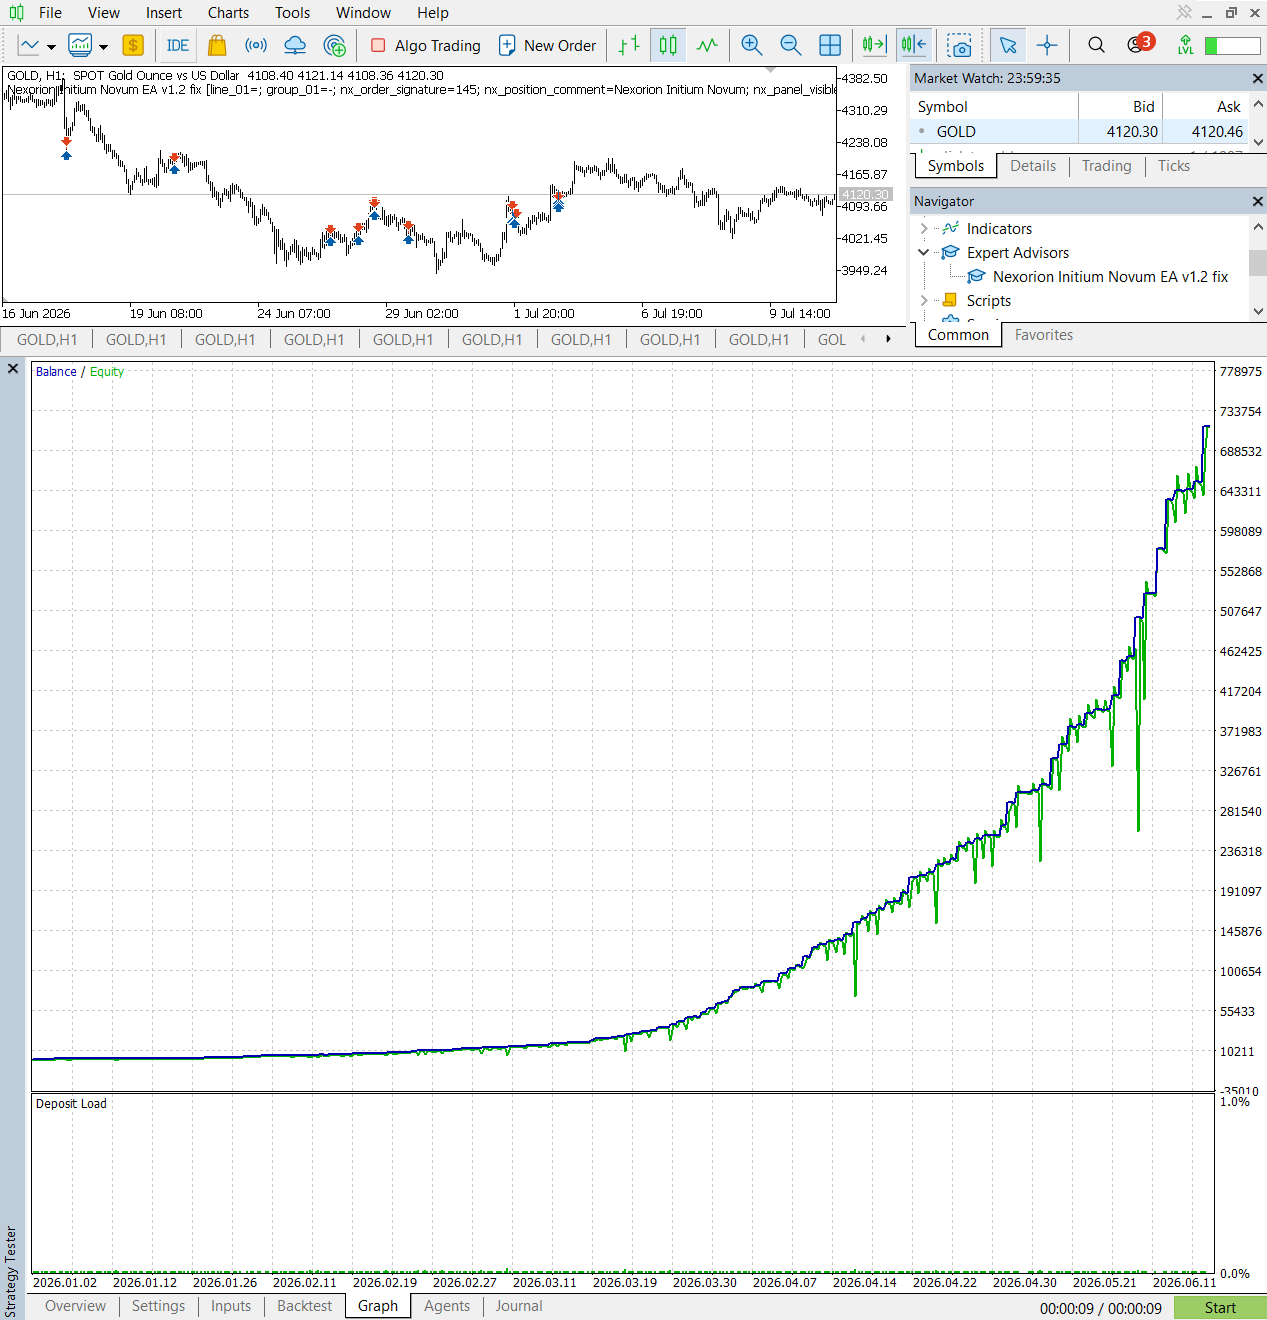
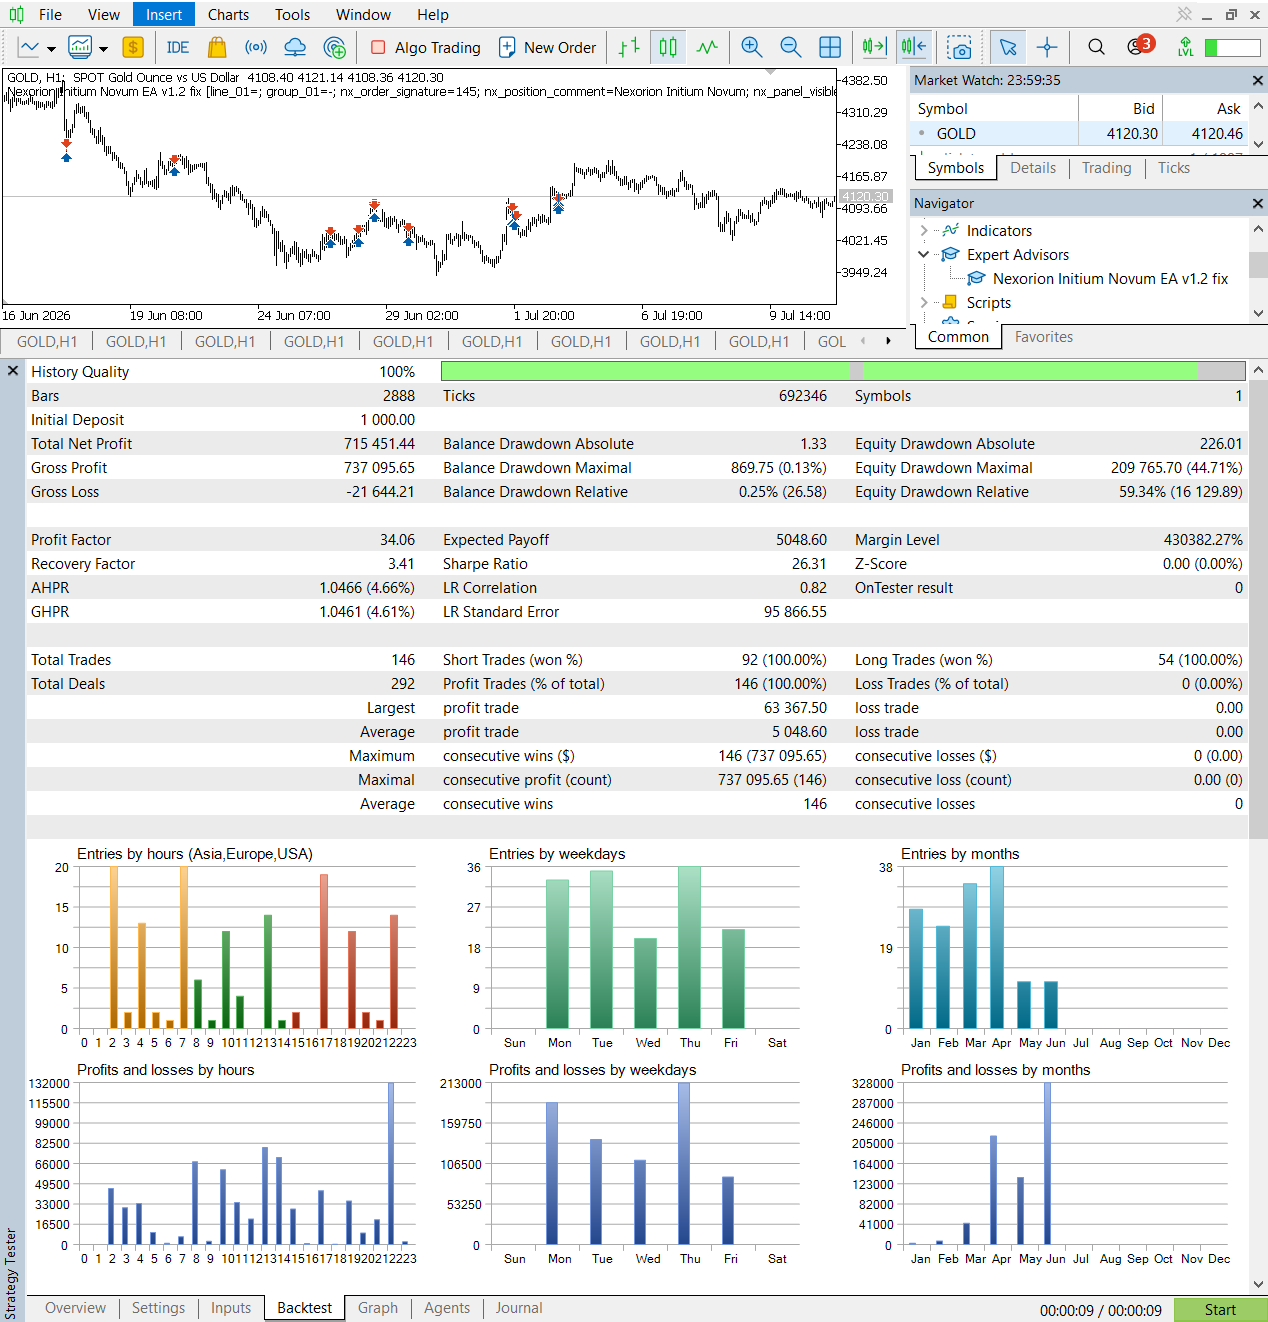
Nexorion: January–June 2026
The source labels this recent six-month test. All 146 completed trades are profitable, while relative equity drawdown reaches 59.34%. The exceptionally large net profit is a sizing-sensitive historical outcome, not a target return. Inspect the equity line alongside the rising closed balance.
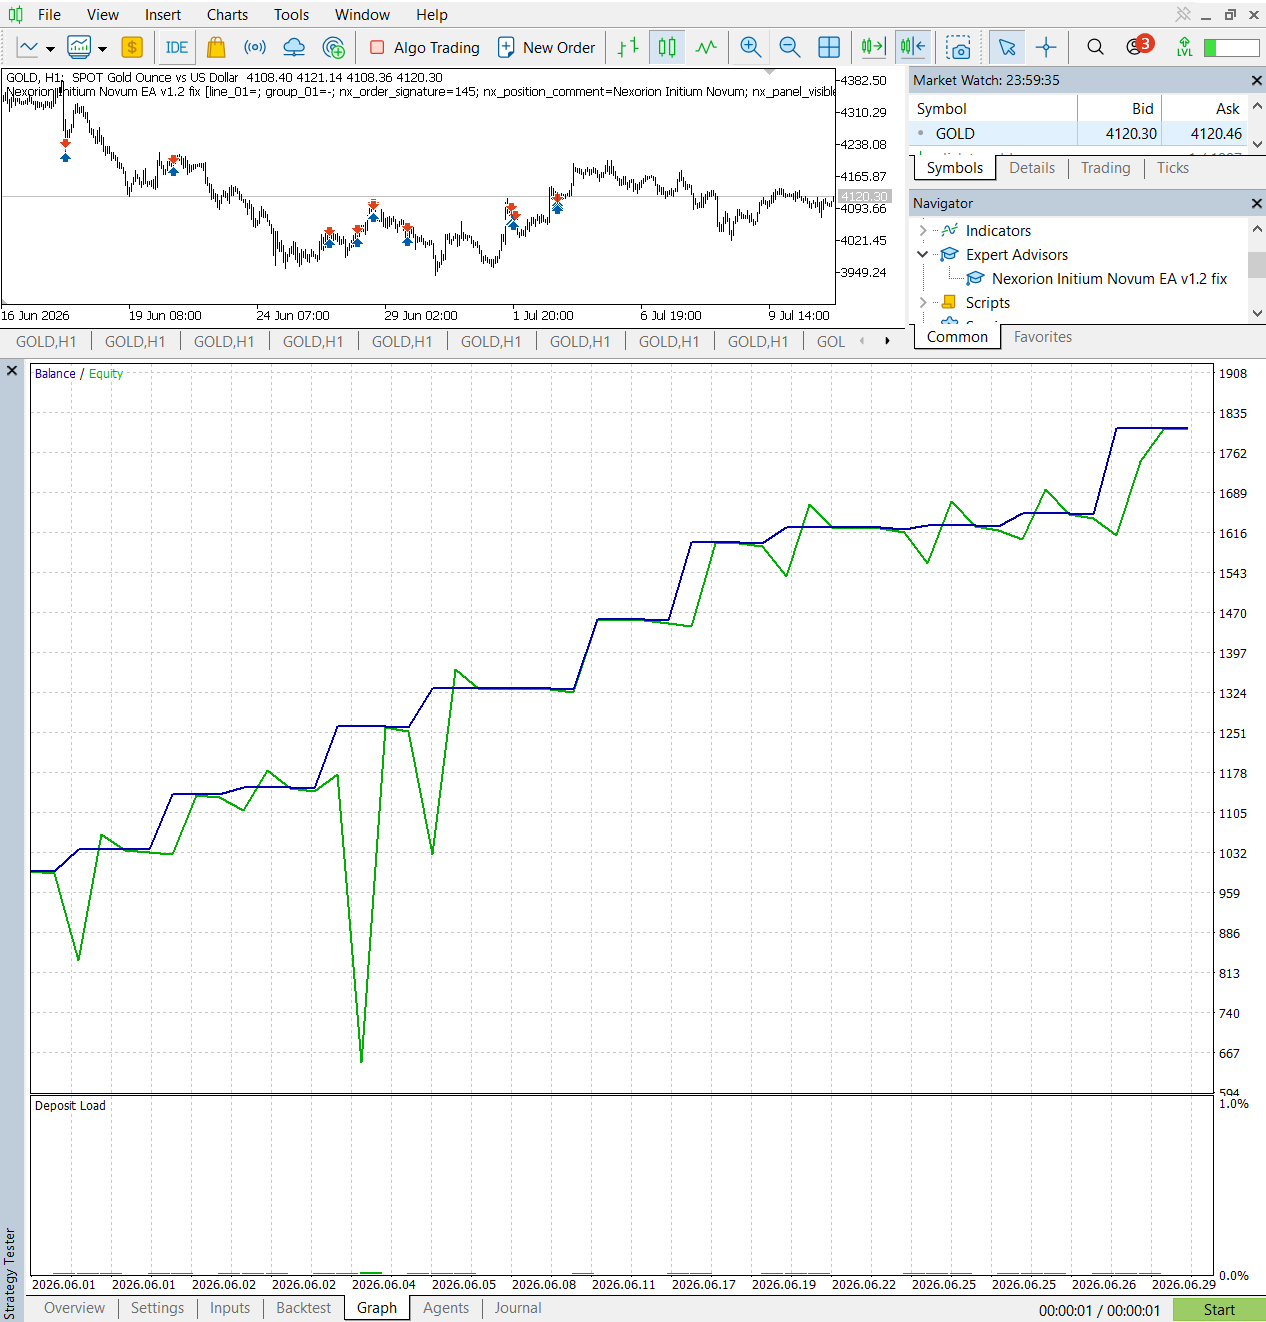
Nexorion: June 2026 Validation
This shorter report contains 11 trades and $806.87 net profit, alongside 44.95% relative equity drawdown. June overlaps the longer recent test, so it is not an independent additional market regime. Eleven closures cannot establish a reliable future win-rate ceiling.
Nexorion: January–June 2016
The older-period test adds historical context: 85 completed trades, profit factor 28.31 and 35.42% relative equity drawdown. Its 96% history quality differs from the newer reports. A successful older sample does not establish an untouched out-of-sample process or eliminate selection bias.
Defined Stops, Selectivity and Floating Drawdown: What the Evidence Means
Both reviews describe defined trade protection and no grid expansion, yet the equity paths differ substantially. TwisterPro separates Mode 1 and Mode 2; Nexorion describes deterministic liquidity-and-equilibrium entries. The presence of a stop does not tell us the account percentage risk unless position size, distance and simultaneous exposure are known.
The recent longer Nexorion test records 146 profitable closures and 59.34% relative equity drawdown. TwisterPro’s longer Mode 1 and Mode 2 samples show 2.95% and 17.67% respectively. These figures are not equal-risk findings. They show why stop labels and win-rate headlines should be checked against floating equity and the actual configuration.
Six pairs are displayed: TwisterPro’s two longer v2.0 modes and Mode 1 June validation, plus Nexorion’s three distinct historical records. TwisterPro Mode 2’s June pair remains available in its original review; it is not silently combined with Mode 1. The older v1.8 forward screenshot also remains separately labelled. Evaluate each configuration before deciding which deserves a small, controlled forward investigation.
A Reproducible Comparison on Your Broker
Choose the same gold contract, feed, capital, leverage and test dates. Save the exact EA build and SET file. Record the sizing method, active modules, stop distances and enabled management options. First compare at a restrained fixed exposure where supported, then examine any balance-based sizing separately.
Include spread, commission, swap and less favourable fills. Record simultaneous volume, margin level, time underwater and floating equity drawdown alongside closed profit. Repeat on an unseen period; do not optimize until the selected historical sample looks perfect. Shorter validation windows inside a longer test are not new independent data.
Keep a complete forward record of open positions, deposits, withdrawals and parameter changes. Selected screenshots help identify a bot but cannot establish a continuous audited track record. If both robots run on gold, assess their combined exposure rather than assuming different strategy names provide diversification.
Build MT5 EAs or copy trades between accounts
BYO-Bot is Windows software for building and testing MT5 strategies without coding. Free Edition exports eligible Single Position bots using standard exits with Loss Recovery off; premium export features require a paid licence. cTrader Copier offers free MT5-to-MT5 copying and MT5-to-cTrader copying with a paid subscription.
TwisterPro Scalper vs Nexorion Initium Novum EA: Frequently Asked Questions
Does a defined Stop Loss establish a fixed account drawdown ceiling?
No. Account drawdown also depends on sizing, concurrent positions and execution. The Nexorion reports illustrate substantial floating equity losses despite the source-described stop protection.
Do these screenshots establish live performance?
No. Historical reports are simulations. Forward screenshots are selected snapshots whose account type, completeness and settings need separate verification; shared-account totals are not standalone EA returns.
Related Gold EA Research
Read the TwisterPro Scalper review and Nexorion Initium Novum EA review for full product context. For another management comparison, see Gold House vs Gold Snap and TwisterPro vs Gold House.
Verdict: Match the Configuration to the Risk Question
TwisterPro Scalper and Nexorion Initium Novum EA address gold trading through different described mechanics. Their tests offer useful questions about activity, exposure and exits without establishing a universal winner. Select a configuration you can reproduce and monitor, rather than the largest exceptional backtest balance.
Explore TwisterPro Scalper vs Nexorion Initium Novum EA
Review the product information and original settings before testing. Confirm the installed version and broker conditions; historical examples do not replace your own monitoring.
Risk Disclaimer
Gold, forex and leveraged CFDs can cause substantial losses. Past simulations and selected forward screenshots do not guarantee future results. Costs, feeds, sizing, execution and connectivity affect outcomes. Use only capital you can afford to lose. This article is educational information, not personalized financial advice.