


Scalping Robot Pro vs Nexorion EA: Tests & Equity Risk
Scalping Robot Pro vs Nexorion Initium Novum EA MT5: Trading Activity and Floating Equity Risk
Compare active M1 gold scalping with H1 liquidity-and-equilibrium entries. Five original tester pairs, source videos and separate forward screenshots show why profitable trade closures and low floating risk are different questions.

Watch Both Original Gold EA Reviews
These original reviews explain the products and historical tests. They support configuration research rather than a controlled head-to-head experiment. Keep each version, settings file and evidence period attached to its results.
Scalping Robot Pro MT5 original review
Nexorion Initium Novum EA MT5 original review
Trade Frequency and Floating Risk Are Different Questions
Scalping Robot Pro
M1 gold scalping with configurable trade management. Its longer report records 26,523 trades and 17.21% relative equity drawdown.
Nexorion Initium Novum EA
H1 liquidity-based entries without source-described grid expansion. Its recent longer report records 146 profitable closures alongside 59.34% relative equity drawdown.
What This Comparison Examines
This Scalping Robot Pro vs Nexorion Initium Novum EA comparison examines trade frequency, optional recovery and floating equity risk. Scalping Robot Pro’s longer test records 26,523 trades; Nexorion’s recent longer test records 146. Activity differs, but fewer trades do not guarantee a smoother equity path.
We use the Scalping Robot Pro review and Nexorion source review. Scalping screenshots identify MT5_2.0_fix and Nexorion screenshots identify v1.2 fix. Described features are source claims, not independent code-audit findings.
Scalping Robot Pro: M1 Entries and Configurable Protection
The original review describes short-term price action, momentum shifts, volatility and trading-condition analysis. The EA can operate in Buy, Sell or Both directions, with session, scheduled-news and holiday controls. The precise proprietary entry formula is not publicly reproduced, so no additional indicator thresholds are assumed here.
Trade management includes configurable Stop Loss, Take Profit, trailing, daily profit limits and drawdown protection. These settings can influence entry availability and the response to adverse movement. Their names alone do not establish a guaranteed maximum account loss.
Fast activity requires cost checks
The longer report records over 26,000 trades. A high count can help reveal repeated behaviour, but correlated entries are not independent experiments. Spread, commission, latency and slippage must be tested under realistic conditions.
Keep optional modes explicit
The forward settings screenshot shows recovery and aggressive modes OFF in that particular setup. The tester header exposes a UseRecoveryMode input, but the visible crop does not reliably establish its value. Do not assume every report used that same forward configuration.
The forward equity-protection input35.0 is a selected setting, not verified threshold enforcement. Confirm its scope and execution in the installed build.
Inspect concurrent trades and combined volume; M1 does not imply one open position.
Scalping Robot Pro Forward-Trading Screenshots
These three uploaded screenshots identify Scalping Robot Pro MT5_2.0_fix through the chart title, dashboard and trade comments. They show selected activity, not complete audited returns. Account currencies and symbol specifications differ, so figures from the views must not be pooled.


View More Forward Trading Results
Nexorion Strategy: Liquidity, Equilibrium and Deterministic Entries
Nexorion’s reviewed design targets XAUUSD/gold on H1. The description combines buy-side and sell-side liquidity tracking, equilibrium calculations, premium/discount classification and mathematical trade validation. Vector-phase resonance is another named component, but the public source does not provide enough detail to reconstruct its equations.
Visual chart mapping shows the algorithm’s selected structures. It may help explain what the system is monitoring, but it does not independently establish an institutional edge or future predictive accuracy.
Source-described protection
The review states that each position receives deterministic Stop Loss protection and excludes grid expansion, averaging and martingale. Confirm that description against the installed version and preset rather than assuming every build behaves identically.
Observed equity behaviour
All completed trades in the three reports are profitable, while relative equity drawdown reaches 35.42%, 44.95% and 59.34%. Profitable closure and low floating risk are different properties.
Those reports do not establish why every closure was positive, exactly how stops evolve or the full sizing rules. Investigate exposure duration, changing lot sizes and the response when liquidity analysis fails. Defined stops remain subject to gaps, slippage, order rejection and platform conditions.
For a no-grid gold EA comparison, the distinction is practical: excluding recovery layers removes one source of expanding exposure, but position size, stop distance and holding behaviour can still create substantial account fluctuations.
Nexorion Forward-Trading Snapshot
The uploaded snapshot contains Nexorion-labelled history rows alongside other EAs. Only those labelled rows can be attributed to Nexorion; the account balance, equity and other dashboard totals are not Nexorion-only performance. Account type, completeness and independent verification are not established.

View More Forward Trading Results
Recommended Brokers and Smaller-Exposure Nano Testing
Spread, commission, slippage and execution can materially affect active gold strategies. In TopTradingEAs’ specific Quantum Queen live comparison, FxPro ranked first and Tickmill second. That experience makes them candidates to investigate, not proof of the same ranking for Scalping Robot Pro or Nexorion Initium Novum EA.
For initial small-exposure live testing, consider an eligible FxPro Nano account. TopTradingEAs uses this cent-denominated account; the FxPro account email describes cent-sized exposure and real execution. For a USD-cent balance, $10 USD appears as 1,000 USC—it is still $10 of capital. Confirm regional availability, gold contract size, minimum volume and the EA’s sizing behaviour before using presets. A numeric 1,000 USC balance is not equivalent to a $1,000 standard-account risk budget.
Demo testing remains useful for setup checks, but its fills can differ from live execution. Nano results also do not guarantee standard-account outcomes. Compare actual costs and equity risk before increasing exposure.
Broker links are referral links; TopTradingEAs may receive compensation. Check the applicable entity and account conditions before opening an account.
Five Historical MT5 Chart and Report Pairs
All five reports display a $1,000 initial deposit. The recent tests show 100% history quality; Nexorion’s 2016 sample shows 96%. Data-quality fields do not verify live execution. June windows overlap the longer recent records and are not independent market regimes.
| Historical sample | Net profit | Profit factor | Relative equity DD | Trades |
|---|---|---|---|---|
| Scalping Robot Pro June | $17,821.02 | 3.44 | 8.76% | 1,470 |
| Scalping Robot Pro Jan–Jun | $338,297.23 | 4.47 | 17.21% | 26,523 |
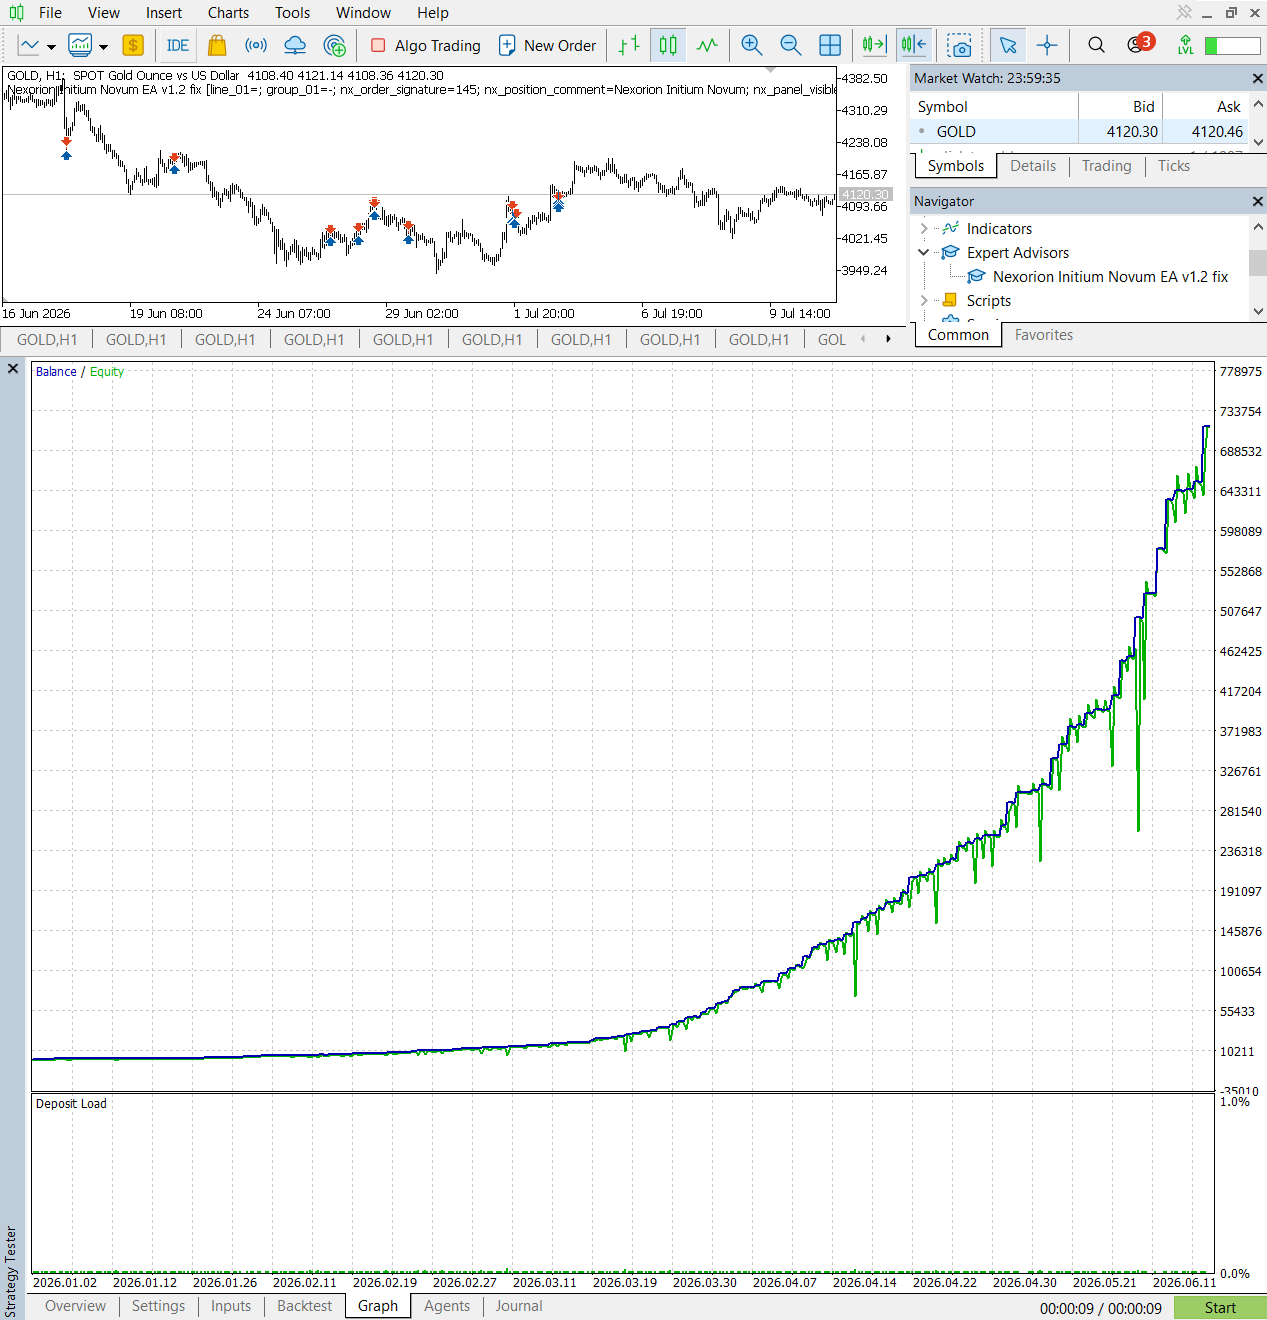
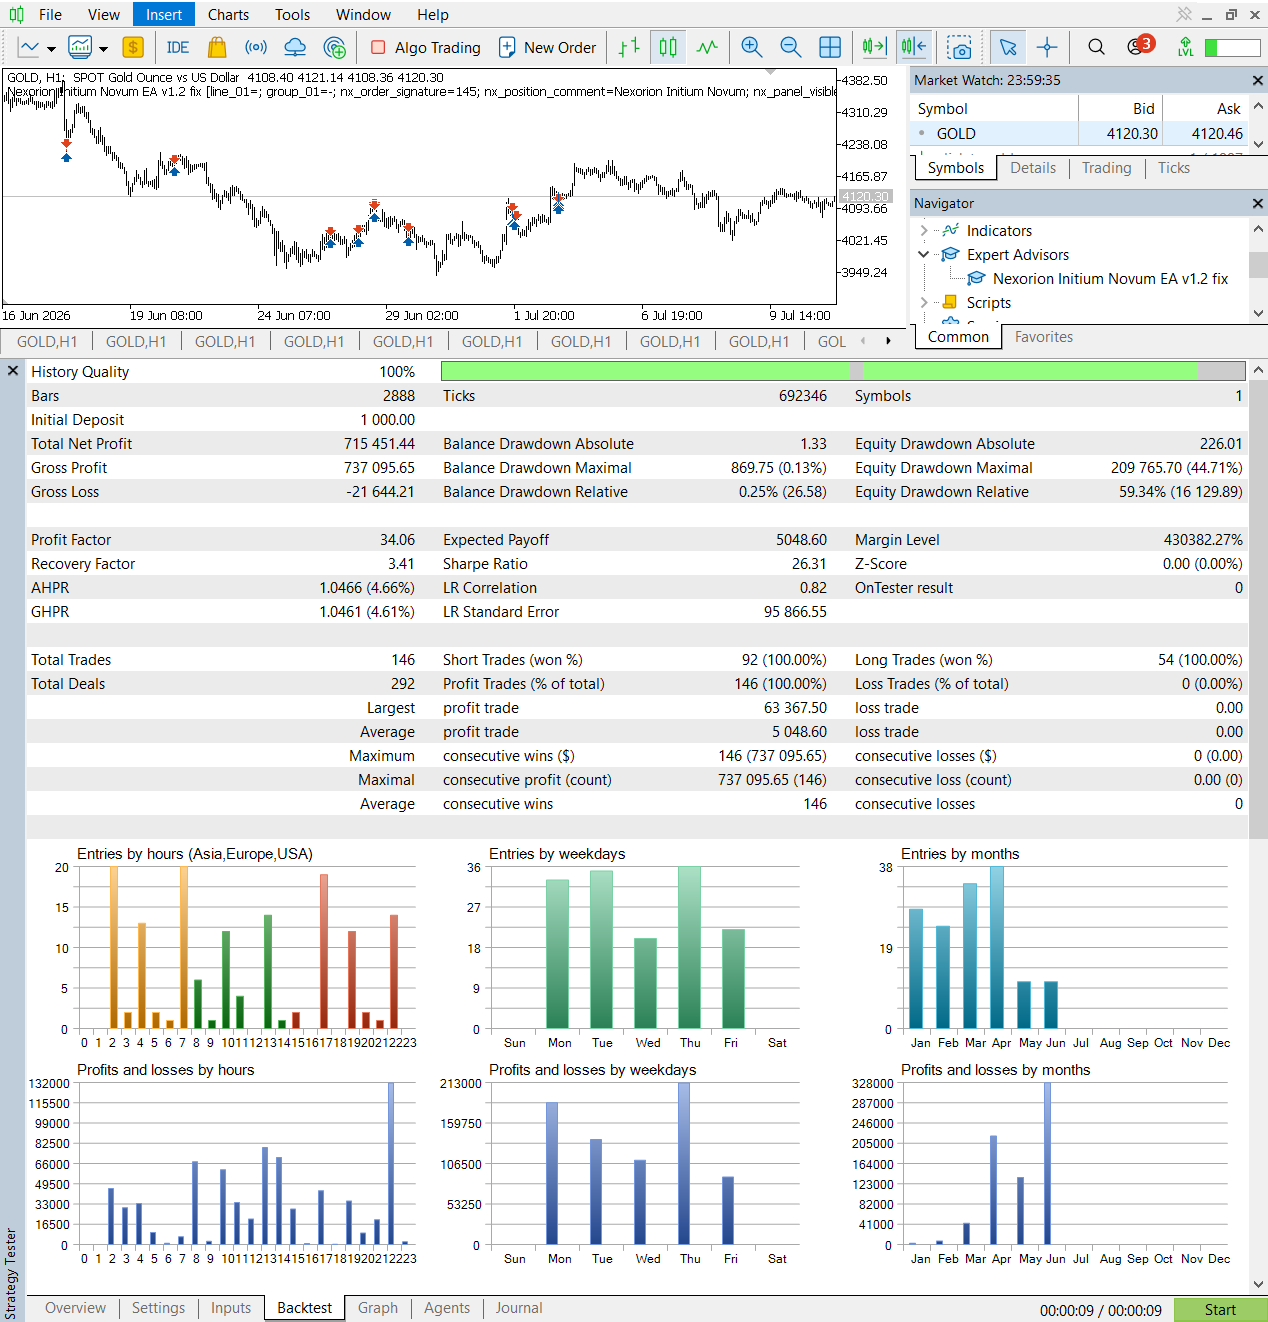
| Nexorion Jan–Jun 2026 | $715,451.44 | 34.06 | 59.34% | 146 |
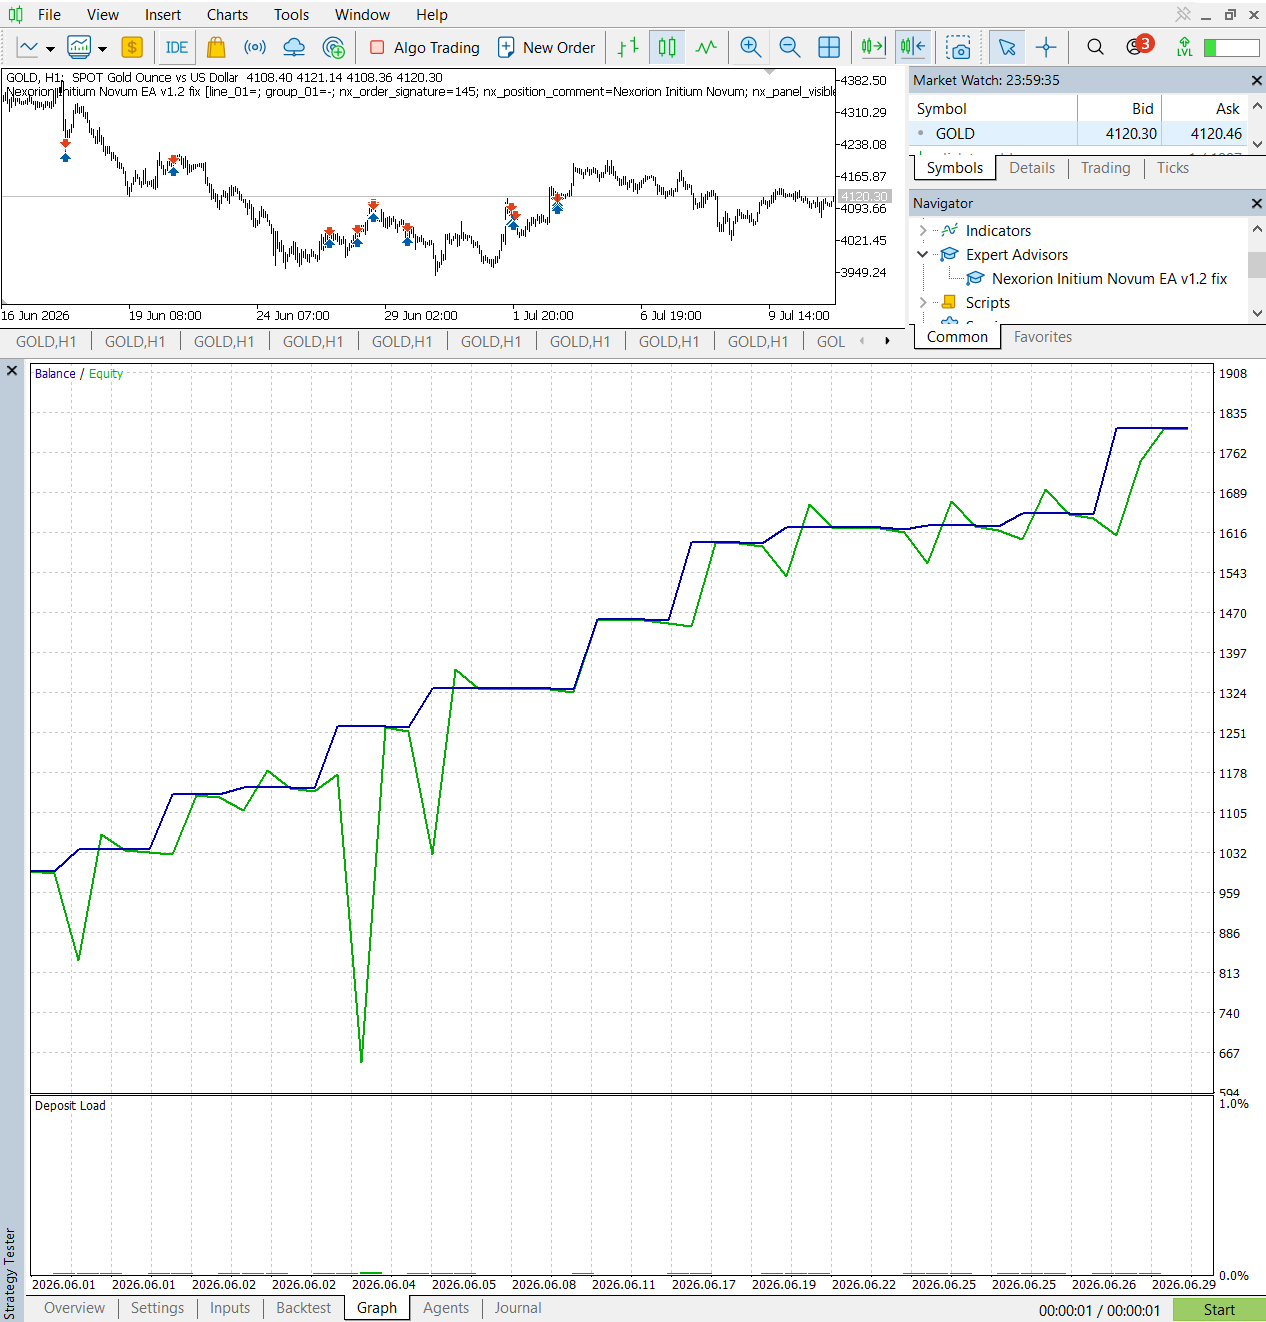
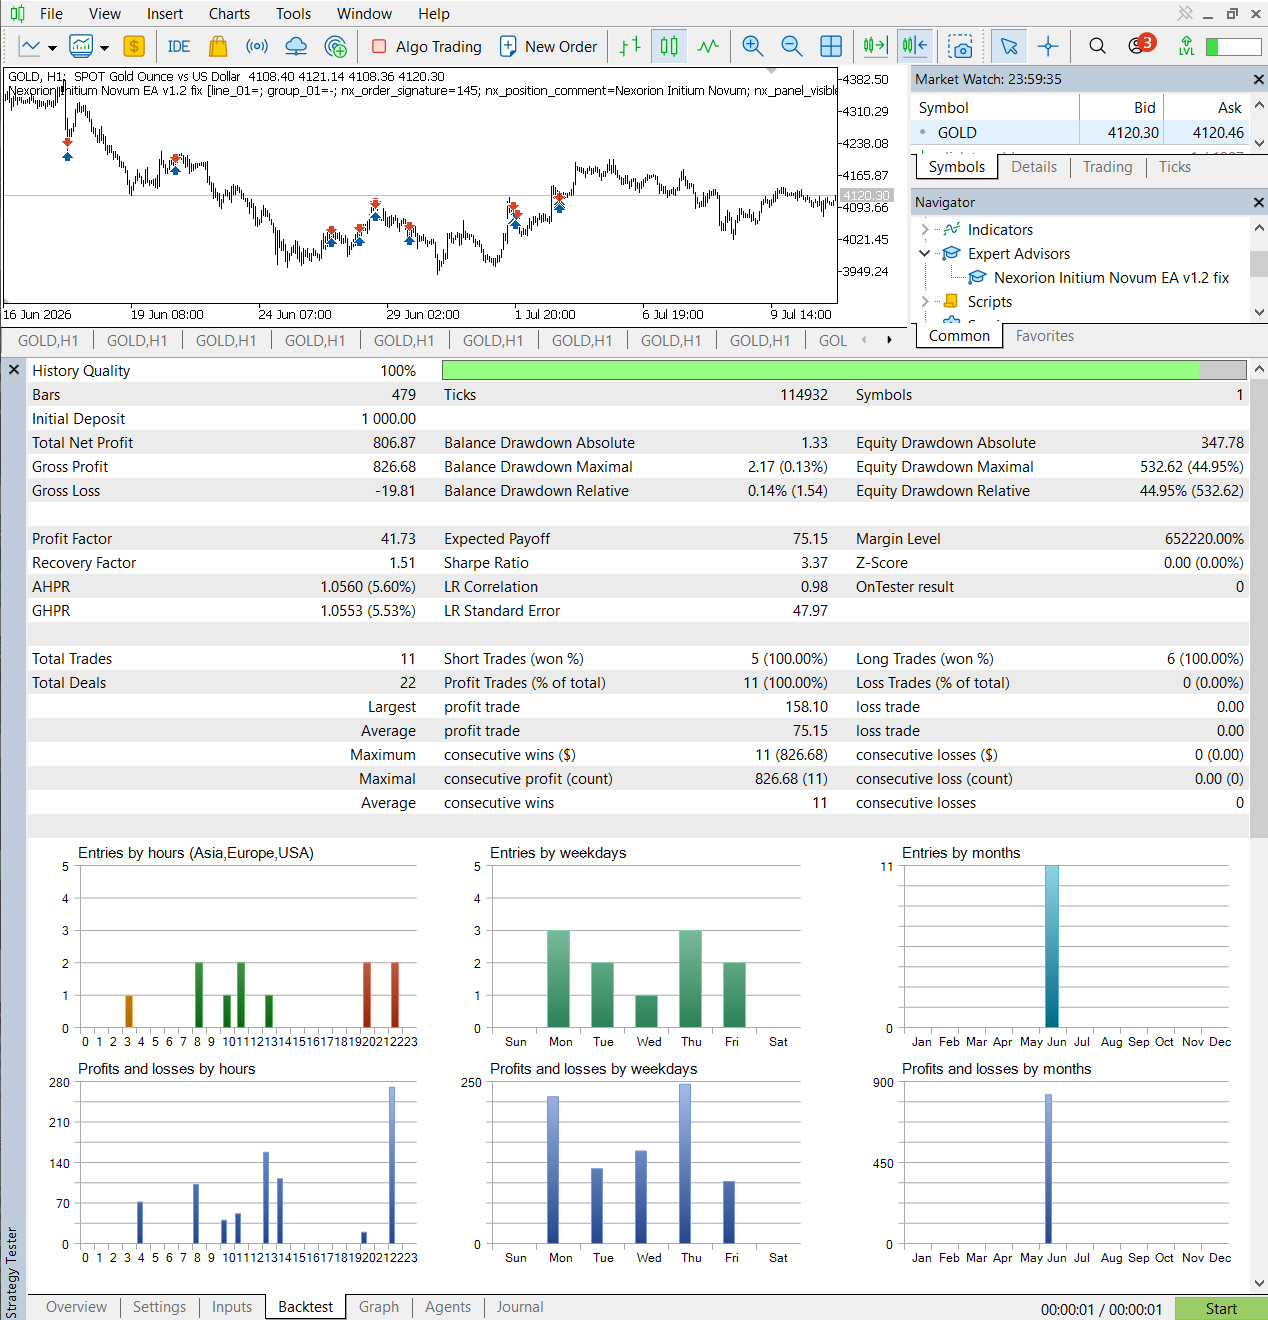
| Nexorion June 2026 | $806.87 | 41.73 | 44.95% | 11 |
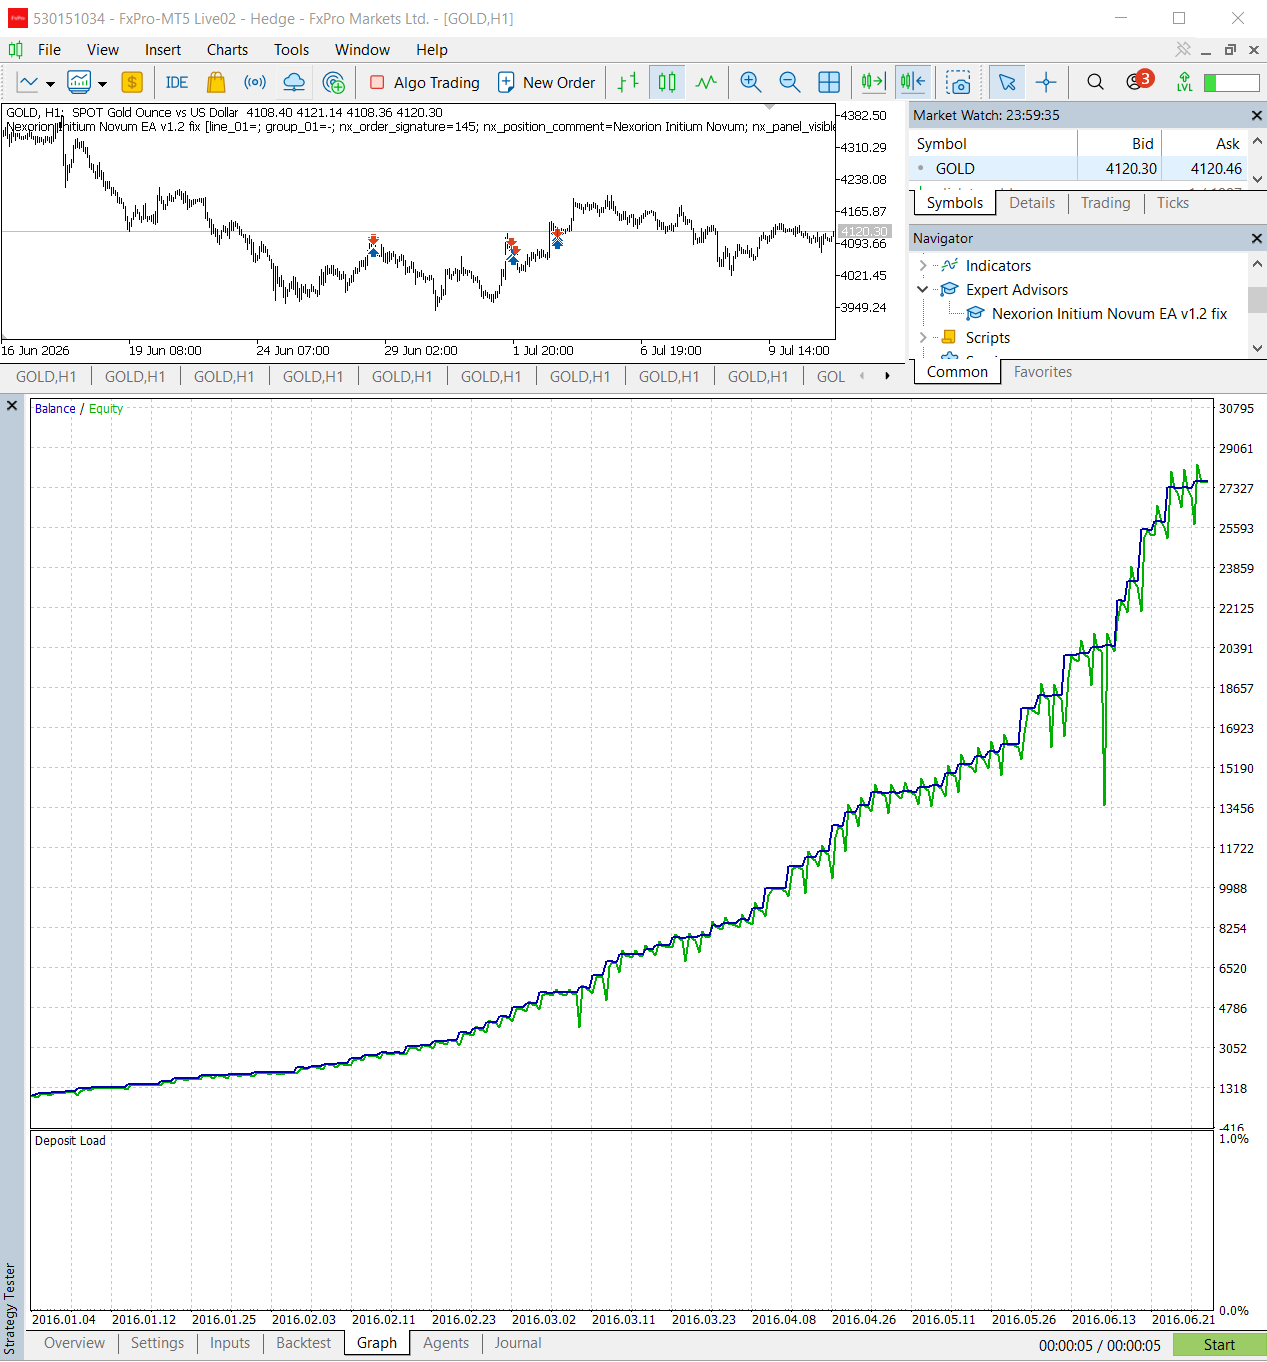
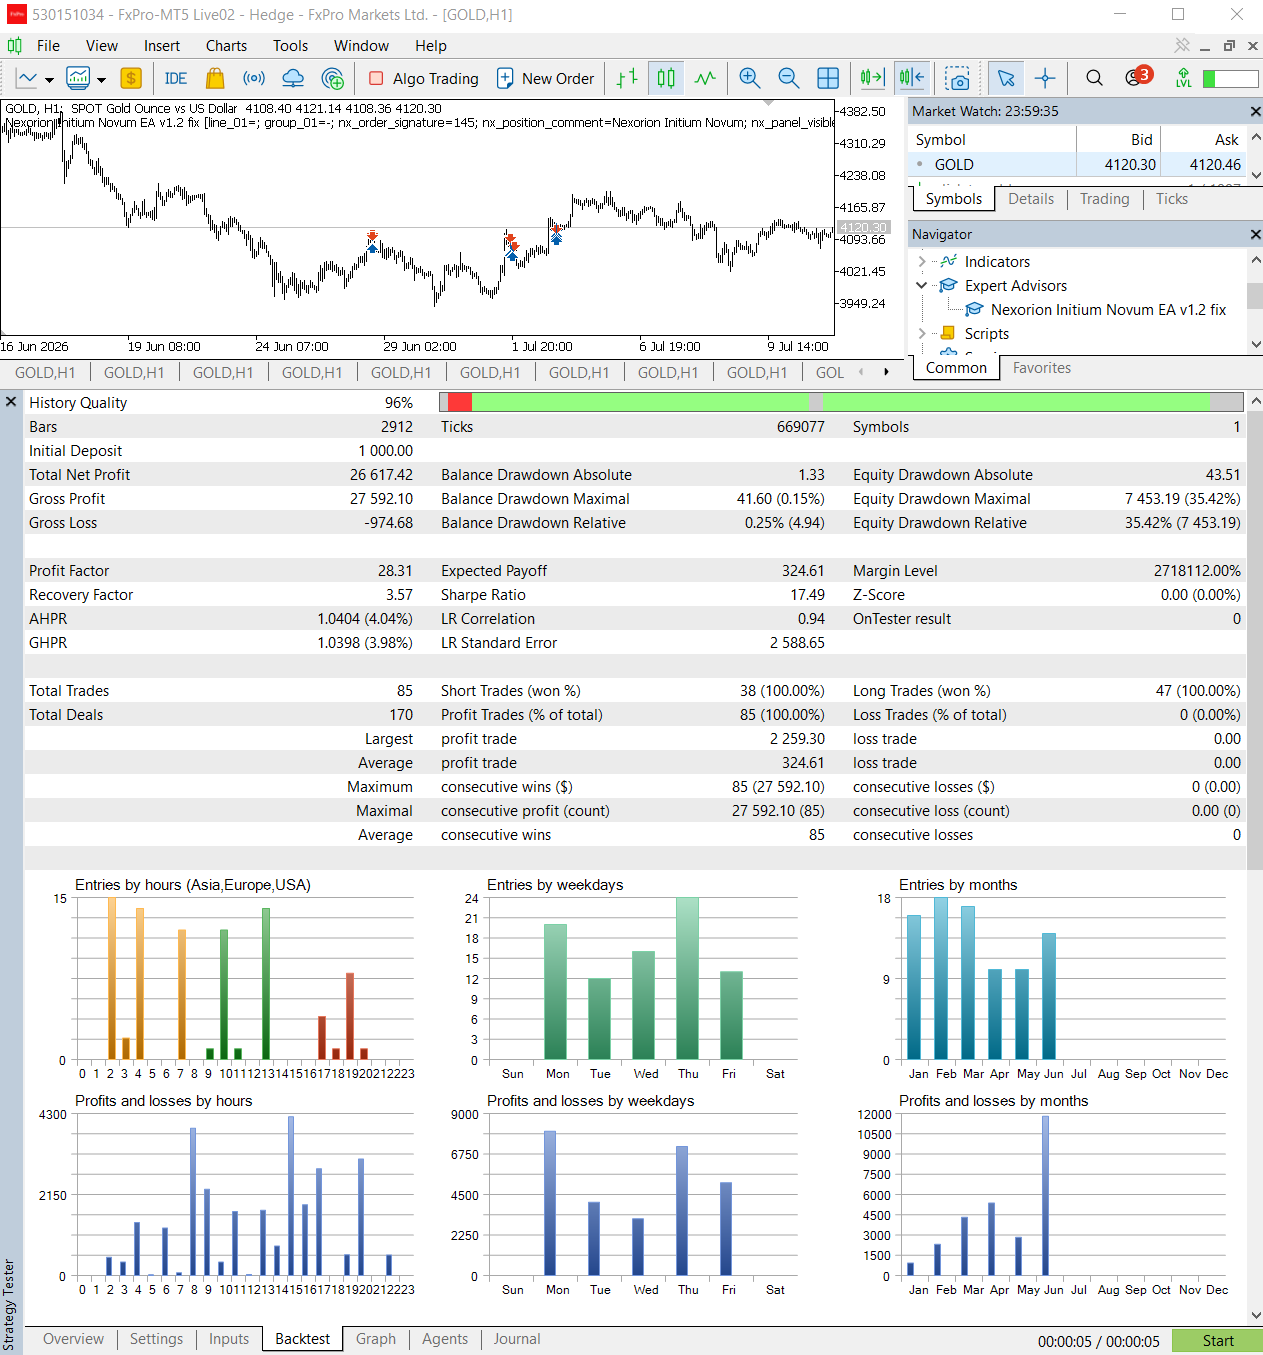
| Nexorion Jan–Jun 2016 | $26,617.42 | 28.31 | 35.42% | 85 |
Relative Equity Drawdown is used consistently. Nexorion’s recent longer report also lists 44.71% beside maximal equity drawdown; it is not the 59.34% relative field. Exceptional simulated profit must not become a live-return target.
Scalping Robot Pro: June 2026
The original chart shows June activity. The matching report contains 1,470 trades, 85.99% profitable trades and 8.76% relative equity drawdown. Average profit per winning trade is $19.89, against an average losing trade of $30.53. That payoff relationship makes the stability of the win rate important.


Scalping Robot Pro: January–June 2026
The longer report records 26,523 trades and 83.34% profitable trades. Relative equity drawdown is 17.21%, distinct from the much smaller 0.27% shown beside maximal equity drawdown. The extraordinarily smooth broad-scale chart should be read together with the numerical drawdown field, not as evidence of negligible risk.


Nexorion: January–June 2026
The source labels this recent six-month test. All 146 completed trades are profitable, while relative equity drawdown reaches 59.34%. The exceptionally large net profit is a sizing-sensitive historical outcome, not a target return. Inspect the equity line alongside the rising closed balance.
Nexorion: June 2026 Validation
This shorter report contains 11 trades and $806.87 net profit, alongside 44.95% relative equity drawdown. June overlaps the longer recent test, so it is not an independent additional market regime. Eleven closures cannot establish a reliable future win-rate ceiling.
Nexorion: January–June 2016
The older-period test adds historical context: 85 completed trades, profit factor 28.31 and 35.42% relative equity drawdown. Its 96% history quality differs from the newer reports. A successful older sample does not establish an untouched out-of-sample process or eliminate selection bias.
Why Profitable Closures Can Hide Floating Losses
Win rate counts completed trades. Equity also reflects unrealized movement while positions remain open. Nexorion’s reports classify every completed trade as profitable, yet relative equity drawdown reaches 35.42%, 44.95% and 59.34%. A positive final closure cannot tell you whether the intervening loss would fit your account.
Scalping Robot Pro has a different observed profile: many more completed trades, including losses, with lower relative equity drawdown in these separate samples. That is useful context, but sizing and incomplete inputs prevent attributing the difference solely to entry logic.
No-grid and no-martingale descriptions exclude particular mechanisms; they are not account-level loss ceilings. Lot size, stop distance, holding time and concurrent positions still matter. Inspect time underwater and maximum adverse excursion alongside the closed balance curve.
Build a Reproducible Broker Test
Use the same gold contract, dates, feed, initial capital, leverage and realistic costs. Save exact versions and SET files. Record Scalping Robot Pro’s optional recovery settings and Nexorion’s sizing and stop behaviour, without filling disclosure gaps with assumptions.
Measure maximum concurrent volume, equity drawdown, margin use, holding time and losing sequences. Repeat with less favourable spreads and fills, then an unseen period. Compare configurations at a defined exposure budget rather than optimizing each ending balance independently.
Keep setup checks separate from live observations. Record account currency, symbol suffix, deposits, withdrawals and settings changes. Review the complete equity path rather than selected profitable rows.
Build MT5 EAs or copy trades between accounts
BYO-Bot is Windows software for building and testing MT5 strategies without coding. Free Edition exports eligible Single Position bots using standard exits with Loss Recovery off; premium export features require a paid licence. cTrader Copier offers free MT5-to-MT5 copying and MT5-to-cTrader copying with a paid subscription.
Scalping Robot Pro vs Nexorion Initium Novum EA: FAQs
Does Nexorion use recovery like Scalping Robot Pro?
Nexorion’s reviewed description excludes grid expansion, averaging and martingale. Scalping Robot Pro exposes optional recovery; one forward setup shows it OFF. Confirm the installed versions and presets.
Why does Nexorion show winners and deep drawdown?
Win rate counts completed trades. A position can experience a large unrealized loss before closing positively. Future recovery is never guaranteed.
Which EA is safer?
The tests do not establish a universal ranking. Different sizing, periods and incomplete inputs prevent an equal-risk comparison.
Are these Nexorion tests for the latest release?
The screenshots identify v1.2 fix. They must not be relabelled as another version; updated builds require separate evaluation.
Related Reviews and Comparisons
Read the Scalping Robot Pro review and Nexorion Initium Novum EA review for setup context. Continue with Scalping Robot Pro vs TwisterPro and Wave Rider vs Nexorion for other management approaches.
Final Verdict: Verify Exposure Behind Activity
Scalping Robot Pro offers active M1 entries and configurable protection. Nexorion uses a described H1 liquidity-and-equilibrium framework without grid expansion, while its tests still show substantial floating equity declines. Neither a timeframe nor a no-grid label is a complete risk description.
Use the reports to select questions for a reproducible test. Prioritize the management settings, total exposure and execution costs you can verify before choosing by historical profit.
Explore Both Gold EAs
Review specifications and setup resources before selecting a testing configuration.
Risk Disclaimer
Gold, forex and CFDs involve substantial risk. Historical simulations and selected forward screenshots do not guarantee future results. Costs, slippage, feeds, leverage, sizing, connectivity and execution can change outcomes. Simultaneous positions and optional recovery can increase losses. Demo-test first and use capital you can afford to lose. This article is educational information, not financial advice.