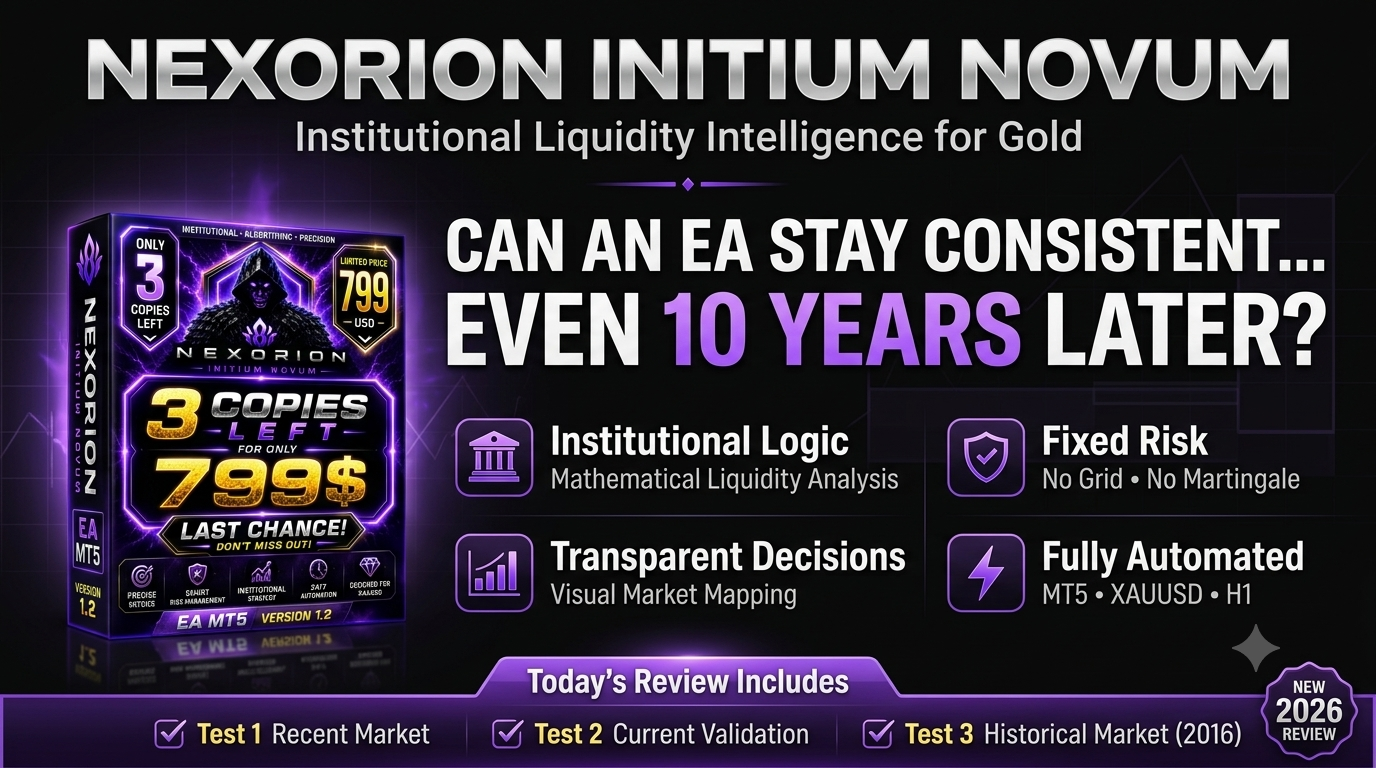
Nexorion Initium Novum EA Review | 3 Backtests & 100% Win Rate
TOPTRADINGEAS REVIEW
Nexorion Initium Novum EA MT5 Review
Complete Nexorion Initium Novum EA review with institutional liquidity analysis, three historical backtests, 2016 market-robustness testing, settings, entry logic, and our final verdict for XAUUSD traders.

Watch the Full Nexorion Initium Novum EA Review
Watch the complete review covering: Product overview, institutional liquidity strategy, three independent backtests, historical robustness, risk analysis, settings, and our final verdict.
Quick Verdict
Market
XAUUSD / Gold
Timeframe
H1
Methodology
Institutional Liquidity Analysis
Risk Model
No Grid • No Martingale
Trade Protection
Deterministic Stop Loss
Main Strength
Consistency Across Market Eras
Nexorion Initium Novum EA Review Summary
Nexorion Initium Novum EA MT5 is an institutional-style Gold Expert Advisor designed for XAUUSD on the H1 timeframe.
Rather than relying on indicator crossovers, Grid trading, Martingale recovery, or subjective entries, Nexorion uses deterministic mathematical logic to identify liquidity zones, equilibrium levels, and structured market opportunities.
What makes this review different is the testing approach. Instead of evaluating the EA only on recent Gold data, we also tested the same trading logic on market conditions from 2016.
The purpose is not simply to find the largest backtest return. It is to evaluate whether the system remains consistent across substantially different market environments.
Introducing Nexorion Initium Novum EA
Nexorion is positioned as a professional analytical and automated trading complex rather than a conventional retail trading robot.
Its core philosophy is described as computational transparency. The Expert Advisor does not merely generate entries. It maps important market structures directly on the chart so users can see how the algorithm interprets liquidity and equilibrium.
This makes Nexorion particularly interesting for traders who want more visibility into the logic behind automated execution.
What Makes This Review Different?
Many Expert Advisors are optimized primarily for recent data. That can make a system look strong during one market regime while producing weaker results when moved into an older or structurally different period.
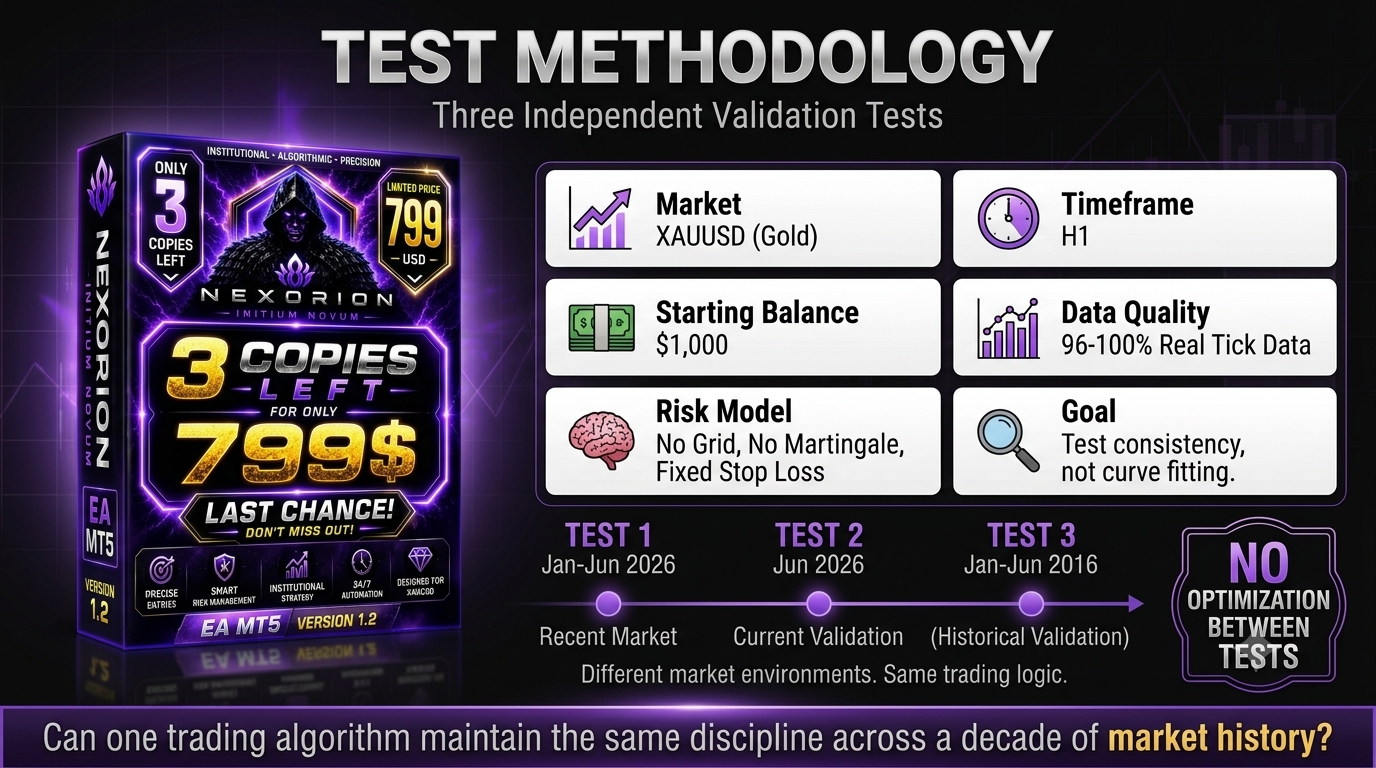
For this review, Nexorion is evaluated through three separate historical tests:
- Test 1: January to June 2026 — recent six-month market test.
- Test 2: June 2026 — one-month current validation.
- Test 3: January to June 2016 — historical market robustness test.
The same Expert Advisor and core trading logic are used across these periods. This helps us evaluate consistency rather than focusing only on one favorable backtest.
How Nexorion Analyzes the Gold Market
Nexorion creates a structured mathematical model of the Gold market by analyzing liquidity and equilibrium rather than relying entirely on conventional technical indicators.
The system focuses on several core analytical modules.
Liquidity Tracking
Identifies Buy-Side Liquidity and Sell-Side Liquidity zones using structured market-phase analysis.
Equilibrium Analysis
Calculates equilibrium levels to classify Premium and Discount market zones.
Vector Phase Resonance
Applies mathematical rules to identify potential transitions between market phases.
Visual Mapping
Displays selected analytical structures directly on the chart for greater transparency.
Deterministic Trading Logic
The term deterministic means that every decision follows a defined set of mathematical rules.
Instead of entering because of emotion, discretion, or a single indicator signal, Nexorion waits for multiple analytical conditions to align before executing a position.
Simplified Decision Process
Liquidity Analysis
↓
Equilibrium Calculation
↓
Premium / Discount Classification
↓
Mathematical Trade Validation
↓
Automated Entry with Stop Loss
Risk Management
Nexorion deliberately excludes several aggressive money-management methods that are often used by high-risk Expert Advisors.
The EA does not use:
- Grid expansion.
- Martingale recovery.
- Position averaging.
Every position receives a deterministic Stop Loss. This creates a clearly defined protection mechanism for each trade.
However, defined Stop Loss protection does not mean the account cannot experience floating equity drawdown. The later test sections examine this risk openly using Relative Equity Drawdown as the main drawdown metric.
Nexorion Trading Specifications
| Specification | Details |
|---|---|
| Platform | MetaTrader 5 |
| Trading Asset | XAUUSD / Gold |
| Working Timeframe | H1 |
| Methodology | Institutional Liquidity and Deterministic Logic |
| Execution | Fully Automated |
| Grid | No |
| Martingale | No |
| Stop Loss | Applied to Every Position |
What This Review Will Measure
- Total Net Profit.
- Historical Return.
- Historical Win Rate.
- Profit Factor.
- Relative Equity Drawdown.
- Total Trades.
- Consistency across recent and older market conditions.
Important Risk Context
A 100% historical win rate does not mean an Expert Advisor is risk-free.
Trades may experience substantial floating losses before eventually closing in profit. For that reason, this review uses Relative Equity Drawdown as the main risk metric rather than relying only on balance drawdown.
Historical testing does not guarantee future performance. Broker data, spread, slippage, execution, leverage, lot sizing, and changing market conditions may all affect live results.
Test 1 — Nexorion Six-Month Backtest
The first performance test evaluates Nexorion Initium Novum EA MT5 over the six-month period from January to June 2026.
The EA was tested on XAUUSD using the H1 timeframe with a $1,000 initial deposit. This test represents recent Gold market conditions and provides the primary performance benchmark for the review.
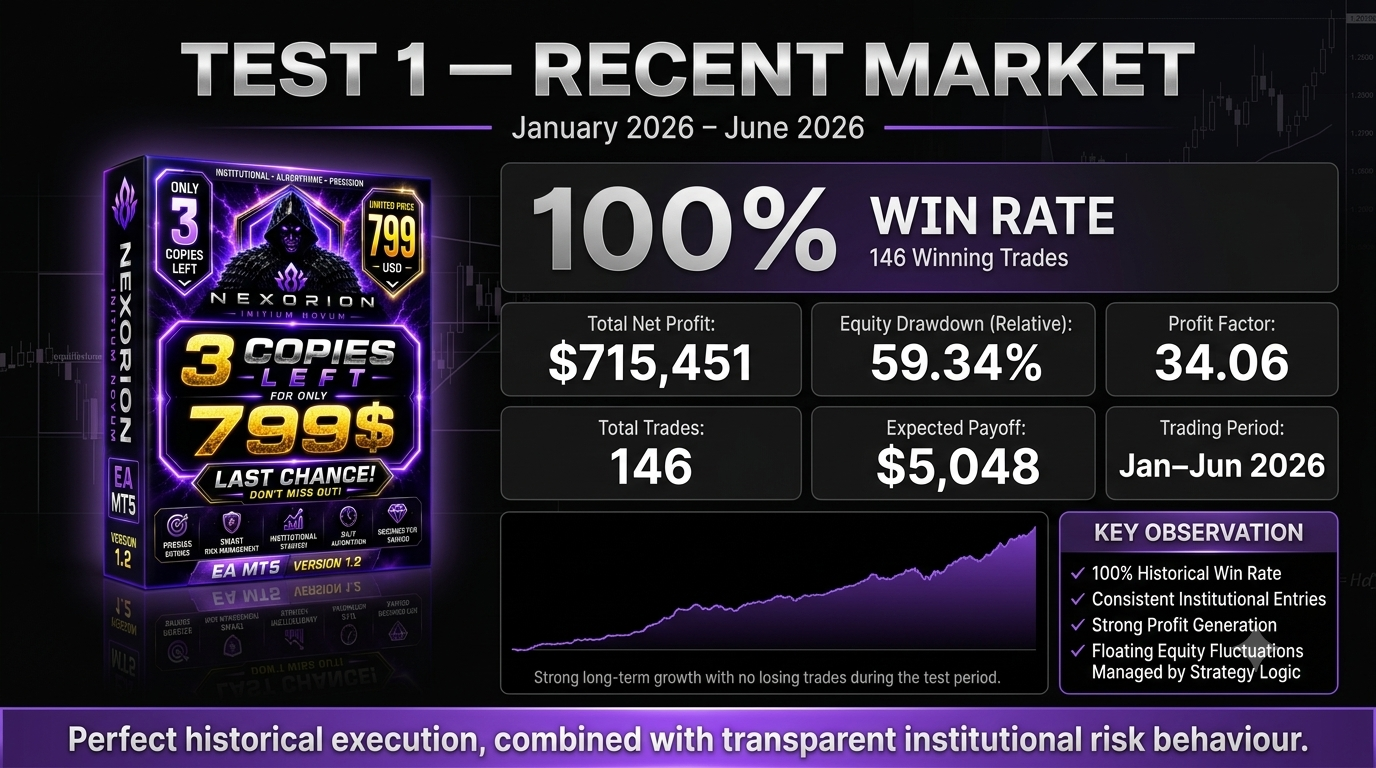
Nexorion recorded a 100% historical win rate across 146 completed trades. However, the account also experienced meaningful floating fluctuations, so this review highlights Relative Equity Drawdown rather than relying only on closed-balance drawdown.
Six-Month Performance at a Glance
Historical Win Rate
100%
Total Net Profit
$715,451.44
Historical Return
+71,545.14%
Profit Factor
34.06
Relative Equity Drawdown
59.34%
Total Trades
146
Test Conditions
| Test Setting | Value |
|---|---|
| Expert Advisor | Nexorion Initium Novum EA |
| Platform | MetaTrader 5 |
| Symbol | XAUUSD / Gold |
| Timeframe | H1 |
| Test Period | January–June 2026 |
| Initial Deposit | $1,000 |
Detailed Backtest Results
| Metric | Result |
|---|---|
| Initial Deposit | $1,000.00 |
| Total Net Profit | $715,451.44 |
| Historical Return | +71,545.14% |
| Gross Profit | $737,095.65 |
| Gross Loss | -$21,644.21 |
| Profit Factor | 34.06 |
| Recovery Factor | 3.41 |
| Expected Payoff | $5,048.60 |
| Sharpe Ratio | 26.31 |
| Relative Equity Drawdown | 59.34% |
| Total Trades | 146 |
| Winning Trades | 146 of 146 — 100% |
| Losing Trades | 0 of 146 — 0% |
| Short Trades | 92 of 92 profitable |
| Long Trades | 54 of 54 profitable |
| Maximum Consecutive Wins | 146 |
Equity Curve Analysis
The account curve shows substantial historical growth during the six-month period. All 146 trades eventually closed in profit, creating an uninterrupted sequence of winning trade closures.
However, a smooth balance curve does not necessarily mean the account experienced no risk while positions were open. The reported 59.34% Relative Equity Drawdown indicates that the floating account value experienced a significant peak-to-trough decline during the test.
This is an important distinction. Nexorion recorded no losing closed trades, but open positions could still move substantially against the account before eventually reaching a profitable exit.
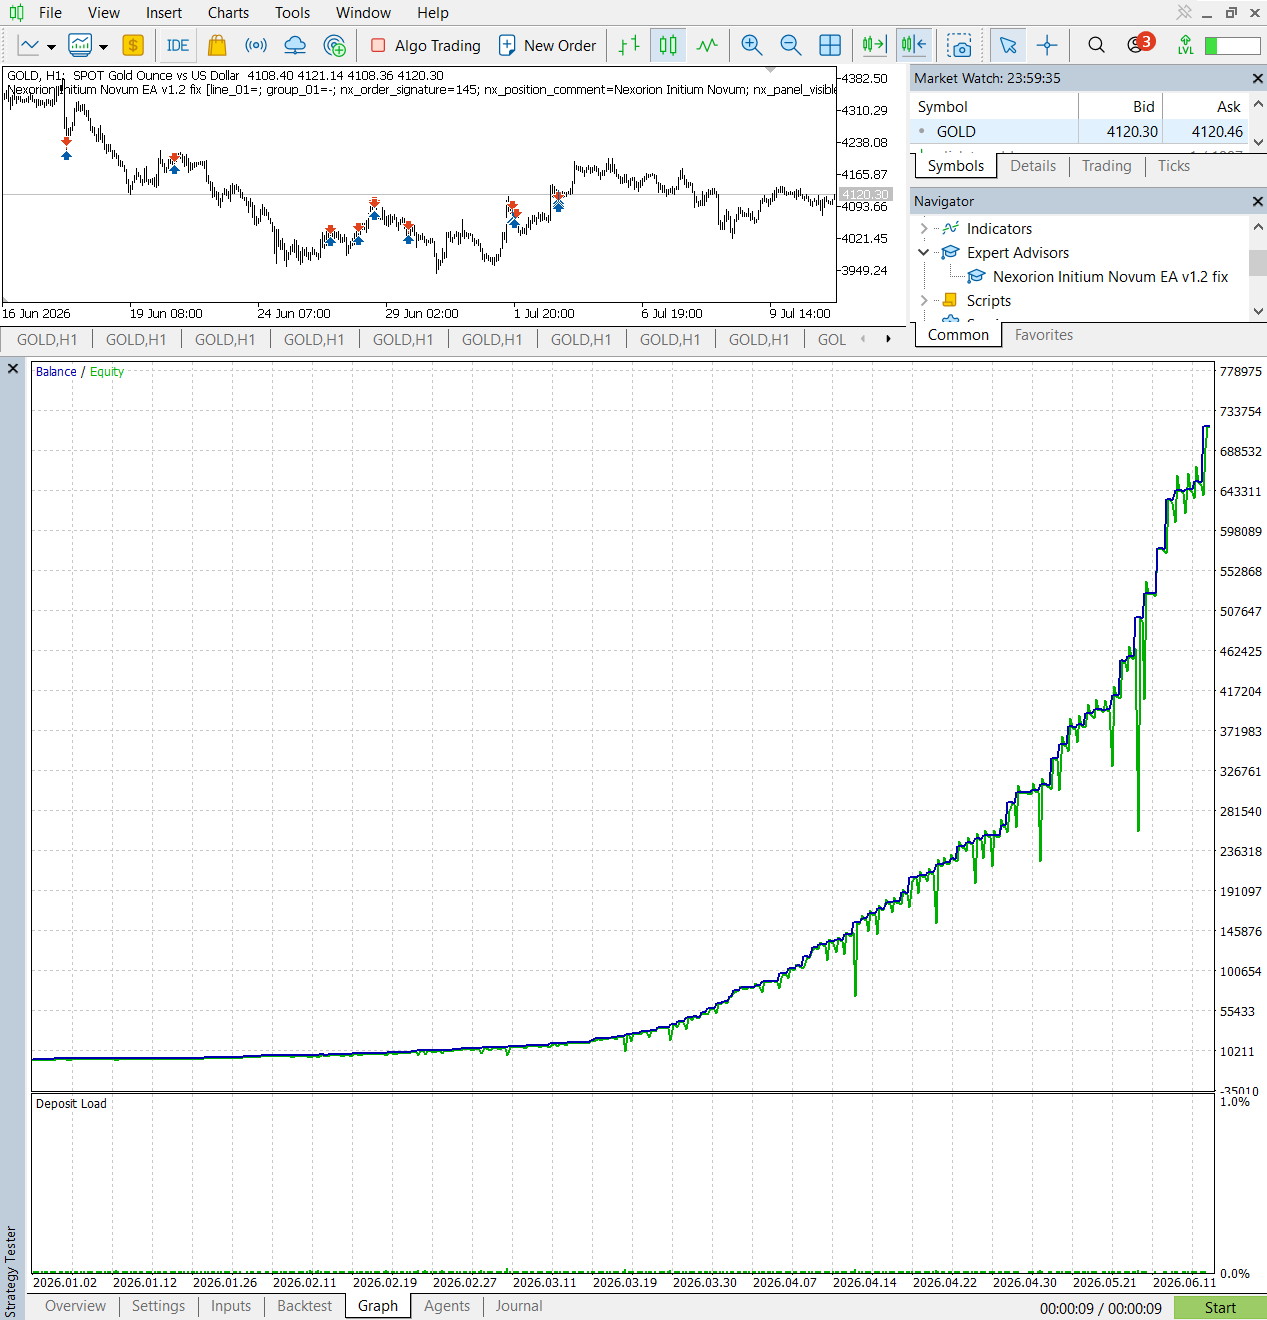
Original MetaTrader 5 Backtest Report
The original MetaTrader 5 Strategy Tester report is included below so readers can inspect the source data used in this analysis.
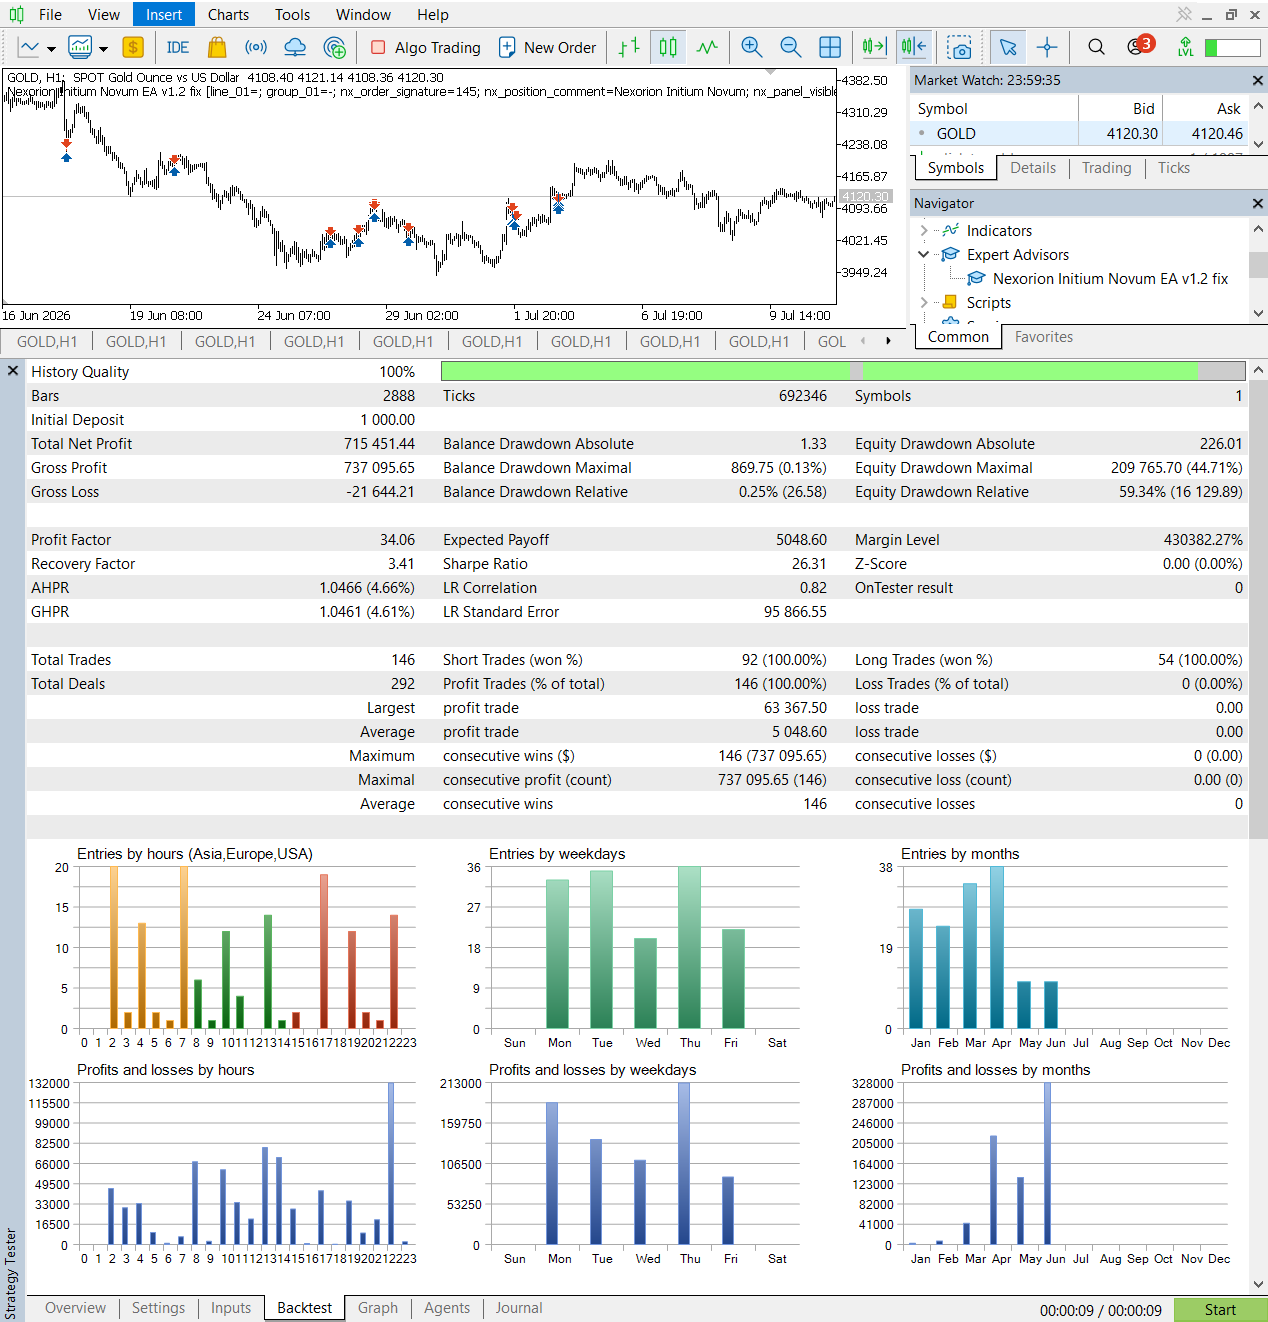
What Does a 100% Historical Win Rate Mean?
A 100% historical win rate means that every completed trade in this specific backtest closed with a positive result.
It does not mean:
- The strategy cannot lose in future trading.
- The account experienced no floating drawdown.
- The same result will occur with every broker or data source.
- The EA is risk-free.
The result is still notable because it covers 146 completed trades over six months. However, the high Relative Equity Drawdown shows why win rate should never be evaluated in isolation.
What Stands Out
- 146 profitable trade closures.
- 100% historical win rate.
- High Profit Factor of 34.06.
- Strong total net profit.
- Both long and short trades were profitable.
- Consistent upward balance growth.
Risk Considerations
- Relative Equity Drawdown reached 59.34%.
- Floating risk was much higher than balance drawdown suggested.
- Historical performance cannot guarantee future results.
- Broker data and execution may change live outcomes.
- Appropriate position sizing remains essential.
Test 1 Takeaway
Nexorion delivered an exceptional sequence of 146 profitable historical trades and generated more than $715,000 in total net profit from the original $1,000 starting balance.
The result supports the product’s focus on selective, deterministic trade execution. At the same time, the 59.34% Relative Equity Drawdown shows that the account experienced substantial floating risk while positions were open.
The next section examines the separate June 2026 one-month validation test to see whether Nexorion maintained the same trading behavior over a shorter recent period.
Explore Nexorion Initium Novum EA
Review the complete product details, institutional trading methodology, and available download information.
View Nexorion EATest 2 — June 2026 Validation Backtest
The second test evaluates Nexorion Initium Novum EA over the shorter period of June 2026.
This one-month test is not intended to replace the main six-month backtest. Its purpose is to check whether Nexorion continued to display the same trading characteristics under a more recent and concentrated market period.
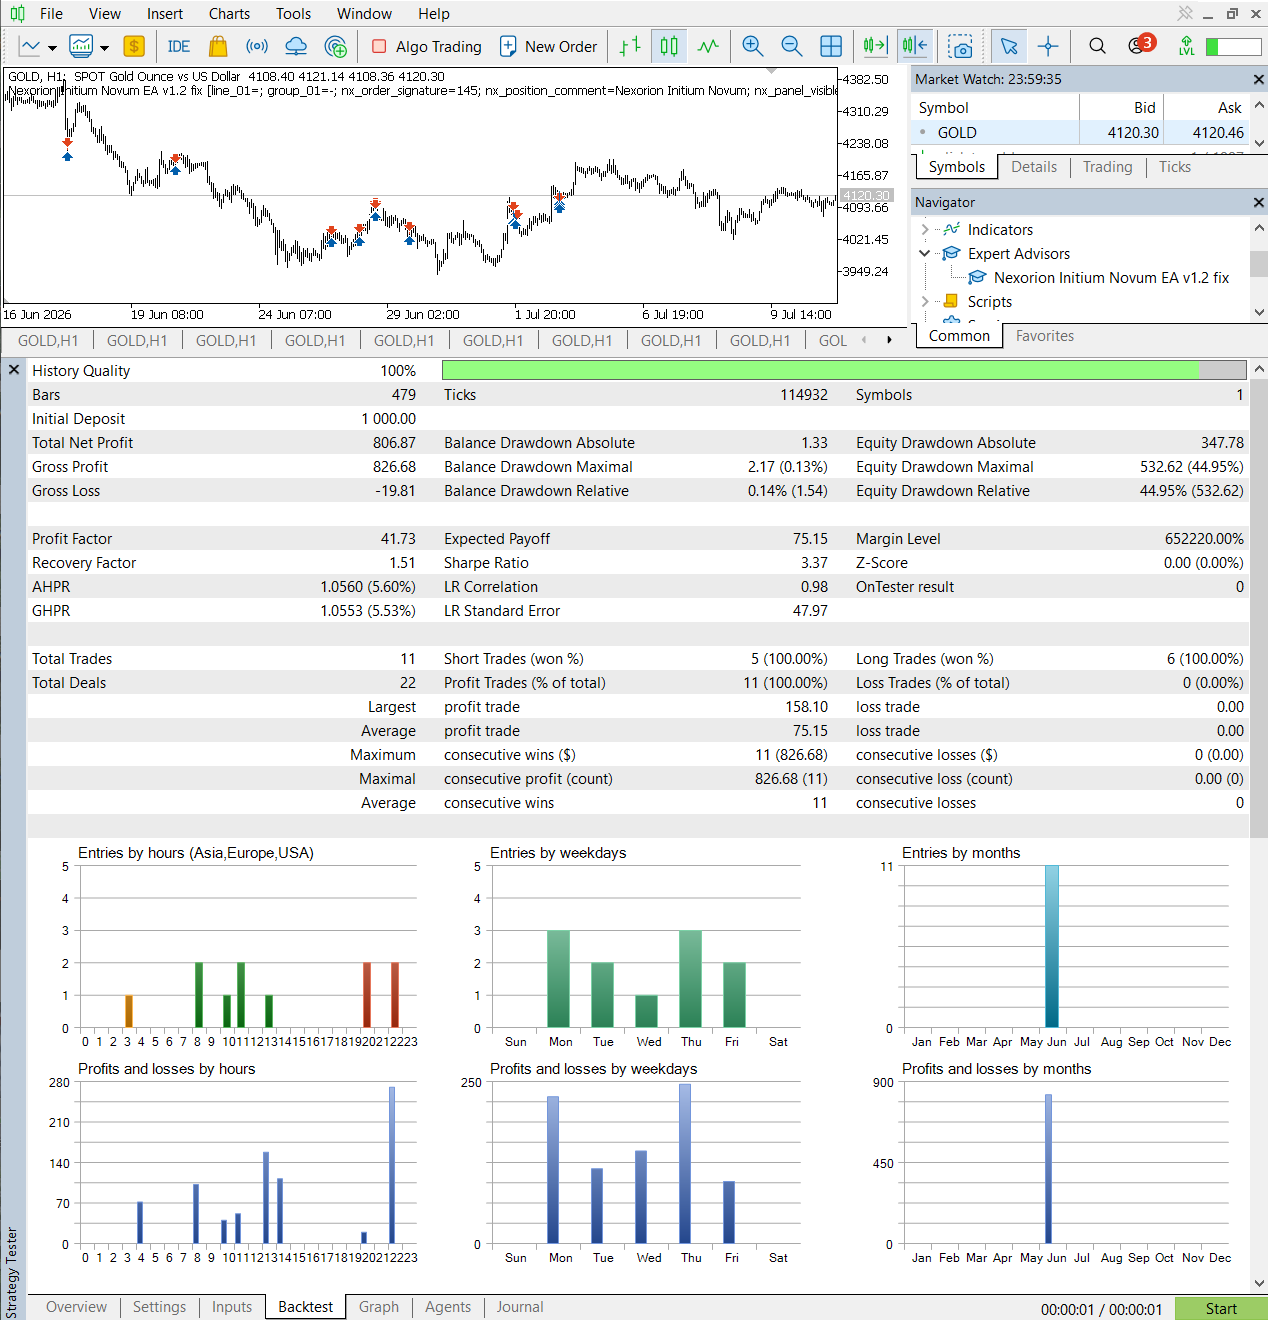
The test used XAUUSD on the H1 timeframe with a $1,000 initial deposit. Nexorion completed 11 trades, and every trade closed in profit in this historical test.
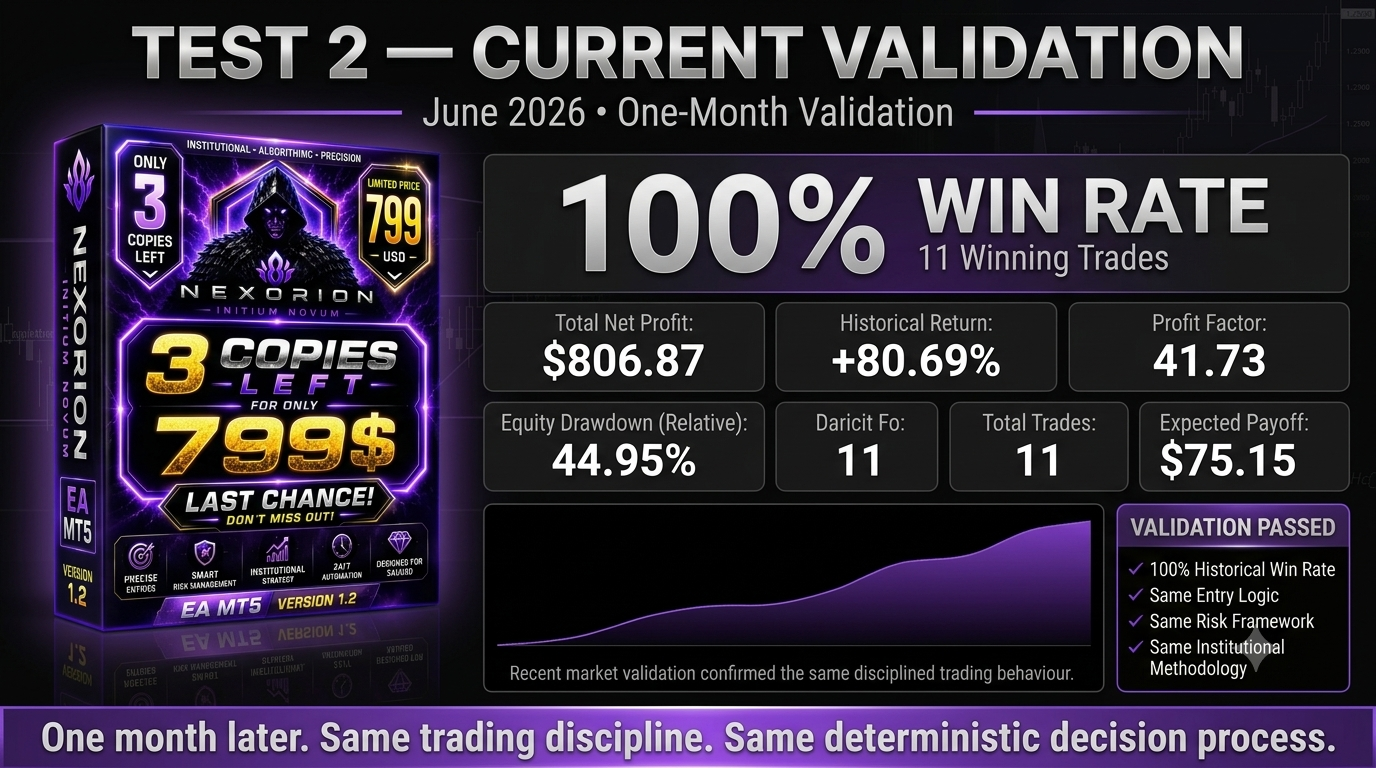
June 2026 Results at a Glance
Historical Win Rate
100%
Total Net Profit
$806.87
Historical Return
+80.69%
Profit Factor
41.73
Relative Equity Drawdown
44.95%
Total Trades
11
Validation Test Conditions
| Test Setting | Value |
|---|---|
| Expert Advisor | Nexorion Initium Novum EA |
| Platform | MetaTrader 5 |
| Symbol | XAUUSD / Gold |
| Timeframe | H1 |
| Test Period | June 2026 |
| Initial Deposit | $1,000 |
Detailed One-Month Results
| Metric | Result |
|---|---|
| Initial Deposit | $1,000.00 |
| Ending Balance | $1,806.87 |
| Total Net Profit | $806.87 |
| Historical Return | +80.69% |
| Gross Profit | $826.68 |
| Gross Loss | -$19.81 |
| Profit Factor | 41.73 |
| Recovery Factor | 1.51 |
| Expected Payoff | $75.15 |
| Sharpe Ratio | 3.37 |
| Relative Equity Drawdown | 44.95% |
| Total Trades | 11 |
| Winning Trades | 11 of 11 — 100% |
| Losing Trades | 0 of 11 — 0% |
| Long Trades | 6 of 6 profitable |
| Short Trades | 5 of 5 profitable |
| Maximum Consecutive Wins | 11 |
June 2026 Equity Curve Analysis
The one-month equity curve shows a positive historical result, with all 11 completed trades eventually closing in profit.
The test produced an 80.69% historical return and $806.87 in total net profit from the $1,000 starting balance.
However, the 44.95% Relative Equity Drawdown shows that the account experienced a significant decline in floating equity during open positions. This means the final 100% win rate should not be interpreted as evidence of low risk.
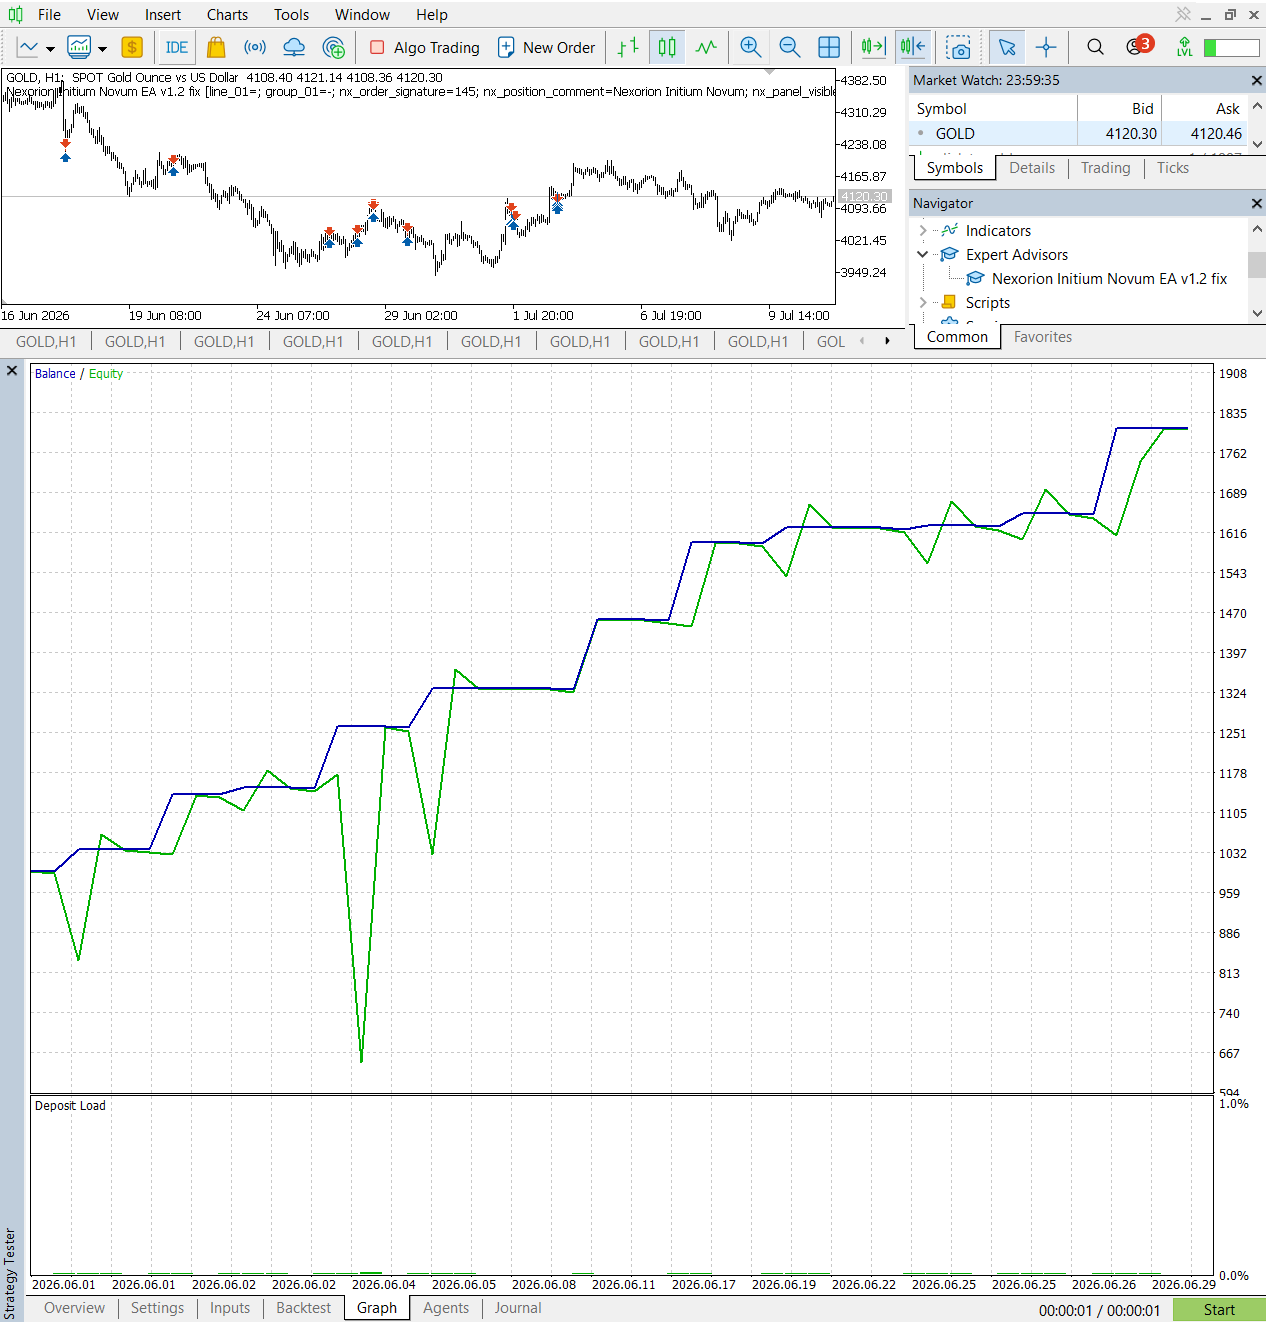
Original June 2026 MetaTrader 5 Report
The original Strategy Tester report is included below so readers can review the source figures used in this section.
How the One-Month Test Compares with the Six-Month Test
| Metric | Jan–Jun 2026 | June 2026 |
|---|---|---|
| Historical Win Rate | 100% | 100% |
| Total Net Profit | $715,451.44 | $806.87 |
| Historical Return | +71,545.14% | +80.69% |
| Profit Factor | 34.06 | 41.73 |
| Relative Equity Drawdown | 59.34% | 44.95% |
| Total Trades | 146 | 11 |
What the Validation Supports
- Nexorion maintained a 100% historical win rate.
- Both long and short trades closed in profit.
- The same H1 Gold trading logic remained active.
- The EA continued to trade selectively.
- The Profit Factor remained high.
What the Validation Does Not Prove
- One profitable month does not guarantee future profitability.
- Eleven trades are a relatively small statistical sample.
- A 100% win rate does not eliminate floating account risk.
- The 44.95% Relative Equity Drawdown remains significant.
- Live execution may differ from historical Strategy Tester results.
Test 2 Takeaway
Nexorion continued to display the same core behavior during the June 2026 validation period: selective trade execution, no losing closed trades, and a high Profit Factor.
The EA produced $806.87 in total net profit and an 80.69% historical return from the original $1,000 deposit.
The 44.95% Relative Equity Drawdown remains the most important risk consideration. It shows that the EA’s perfect historical win rate was achieved while tolerating substantial temporary equity fluctuations.
The next section moves back ten years to January through June 2016 to test whether the same trading logic remained effective under a significantly different Gold market environment.
Next: The 2016 Historical Robustness Test
The third test evaluates the same Nexorion trading logic using Gold market data from ten years earlier.
View Nexorion EATest 3 — Nexorion Historical Robustness Test
The third test moves Nexorion away from recent Gold market conditions and evaluates the EA using data from January to June 2016.
This is the most important robustness test in the review because it asks whether the same deterministic entry logic can remain effective in a market environment from approximately ten years earlier.
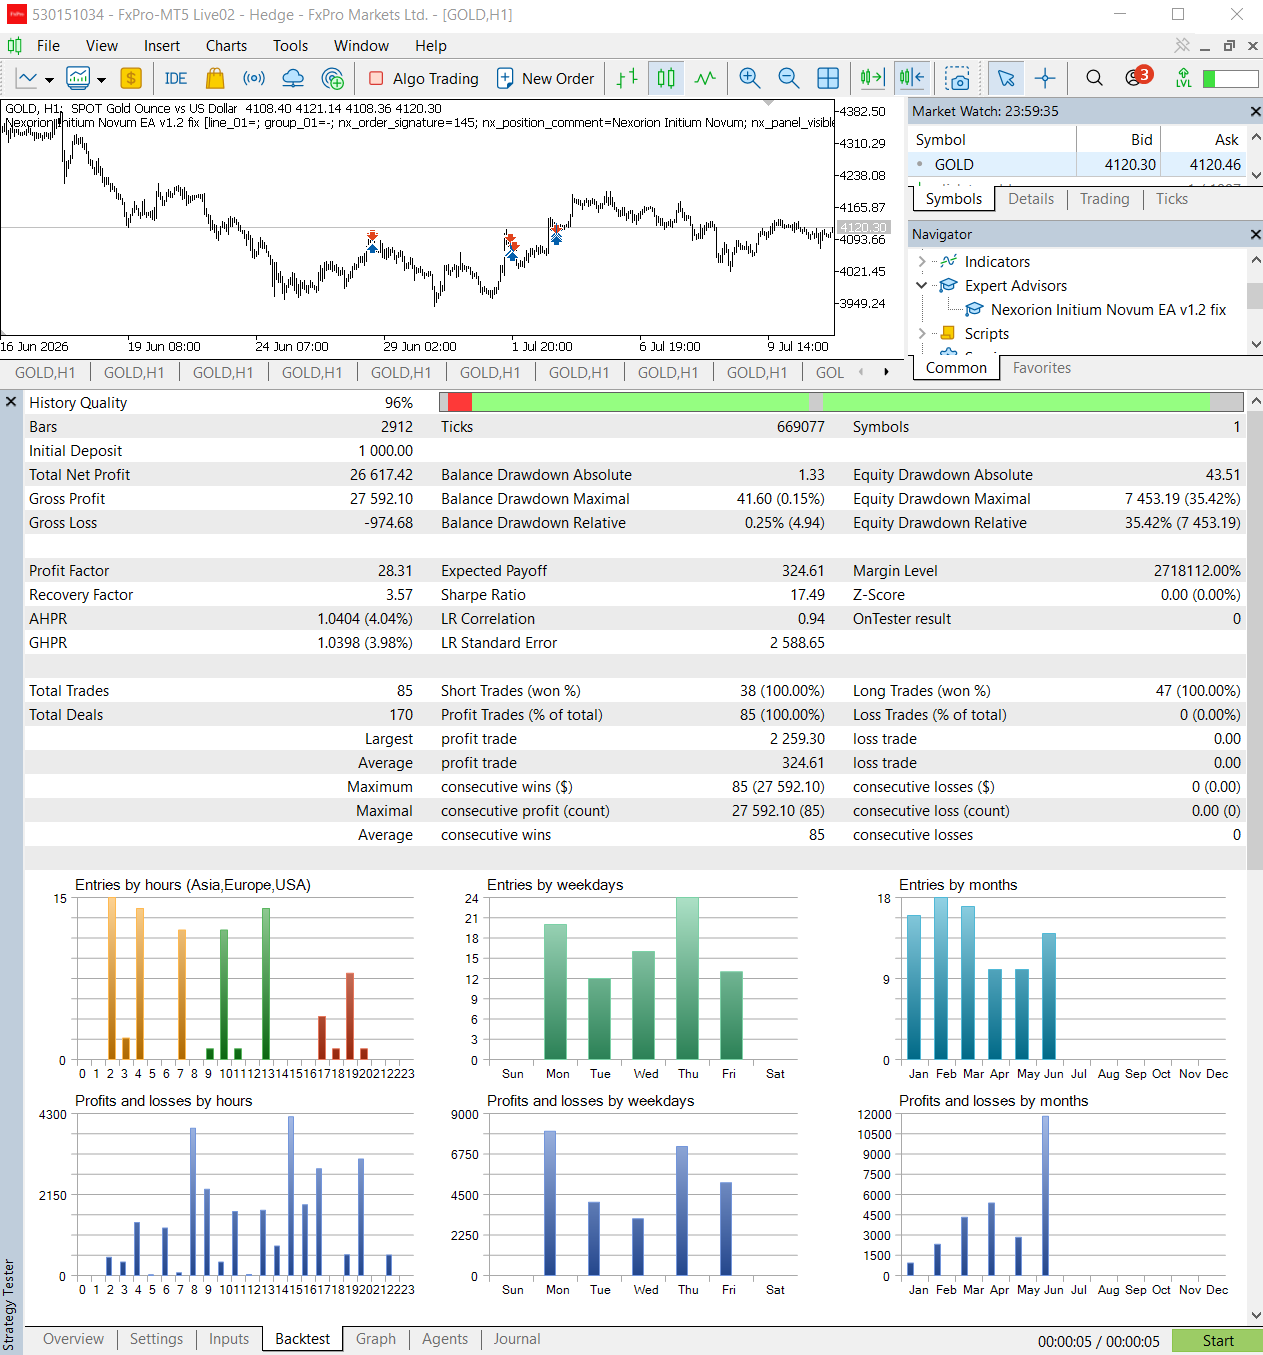
The EA was tested on XAUUSD using the H1 timeframe with a $1,000 initial deposit. Nexorion completed 85 trades, and every completed trade closed in profit during this historical period.
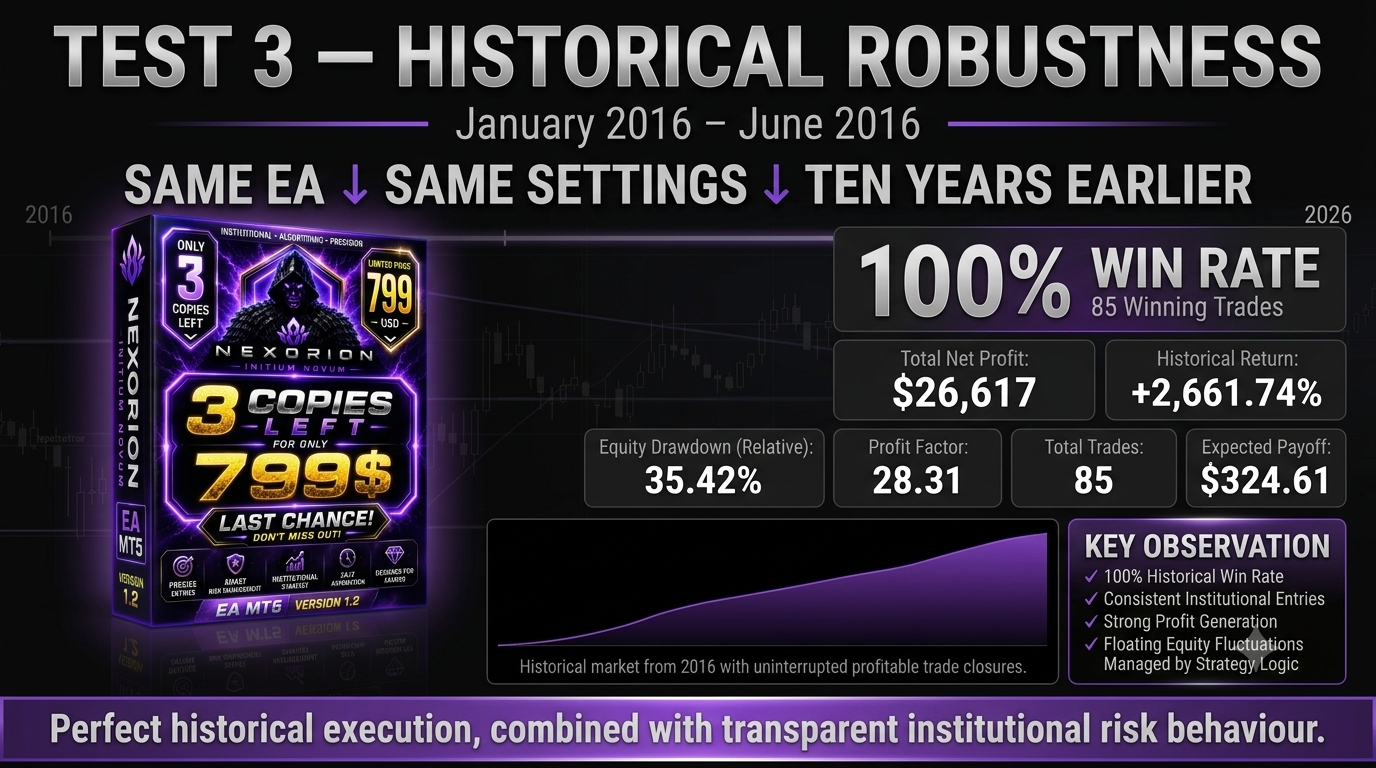
2016 Performance at a Glance
Historical Win Rate
100%
Total Net Profit
$26,617.42
Historical Return
+2,661.74%
Profit Factor
28.31
Relative Equity Drawdown
35.42%
Total Trades
85
Historical Test Conditions
| Test Setting | Value |
|---|---|
| Expert Advisor | Nexorion Initium Novum EA |
| Platform | MetaTrader 5 |
| Symbol | XAUUSD / Gold |
| Timeframe | H1 |
| Test Period | January–June 2016 |
| Initial Deposit | $1,000 |
Detailed 2016 Backtest Results
| Metric | Result |
|---|---|
| Initial Deposit | $1,000.00 |
| Ending Balance | $27,617.42 |
| Total Net Profit | $26,617.42 |
| Historical Return | +2,661.74% |
| Gross Profit | $27,592.10 |
| Gross Loss | -$974.68 |
| Profit Factor | 28.31 |
| Recovery Factor | 3.57 |
| Expected Payoff | $324.61 |
| Sharpe Ratio | 17.49 |
| Relative Equity Drawdown | 35.42% |
| Total Trades | 85 |
| Winning Trades | 85 of 85 — 100% |
| Losing Trades | 0 of 85 — 0% |
| Long Trades | 47 of 47 profitable |
| Short Trades | 38 of 38 profitable |
| Maximum Consecutive Wins | 85 |
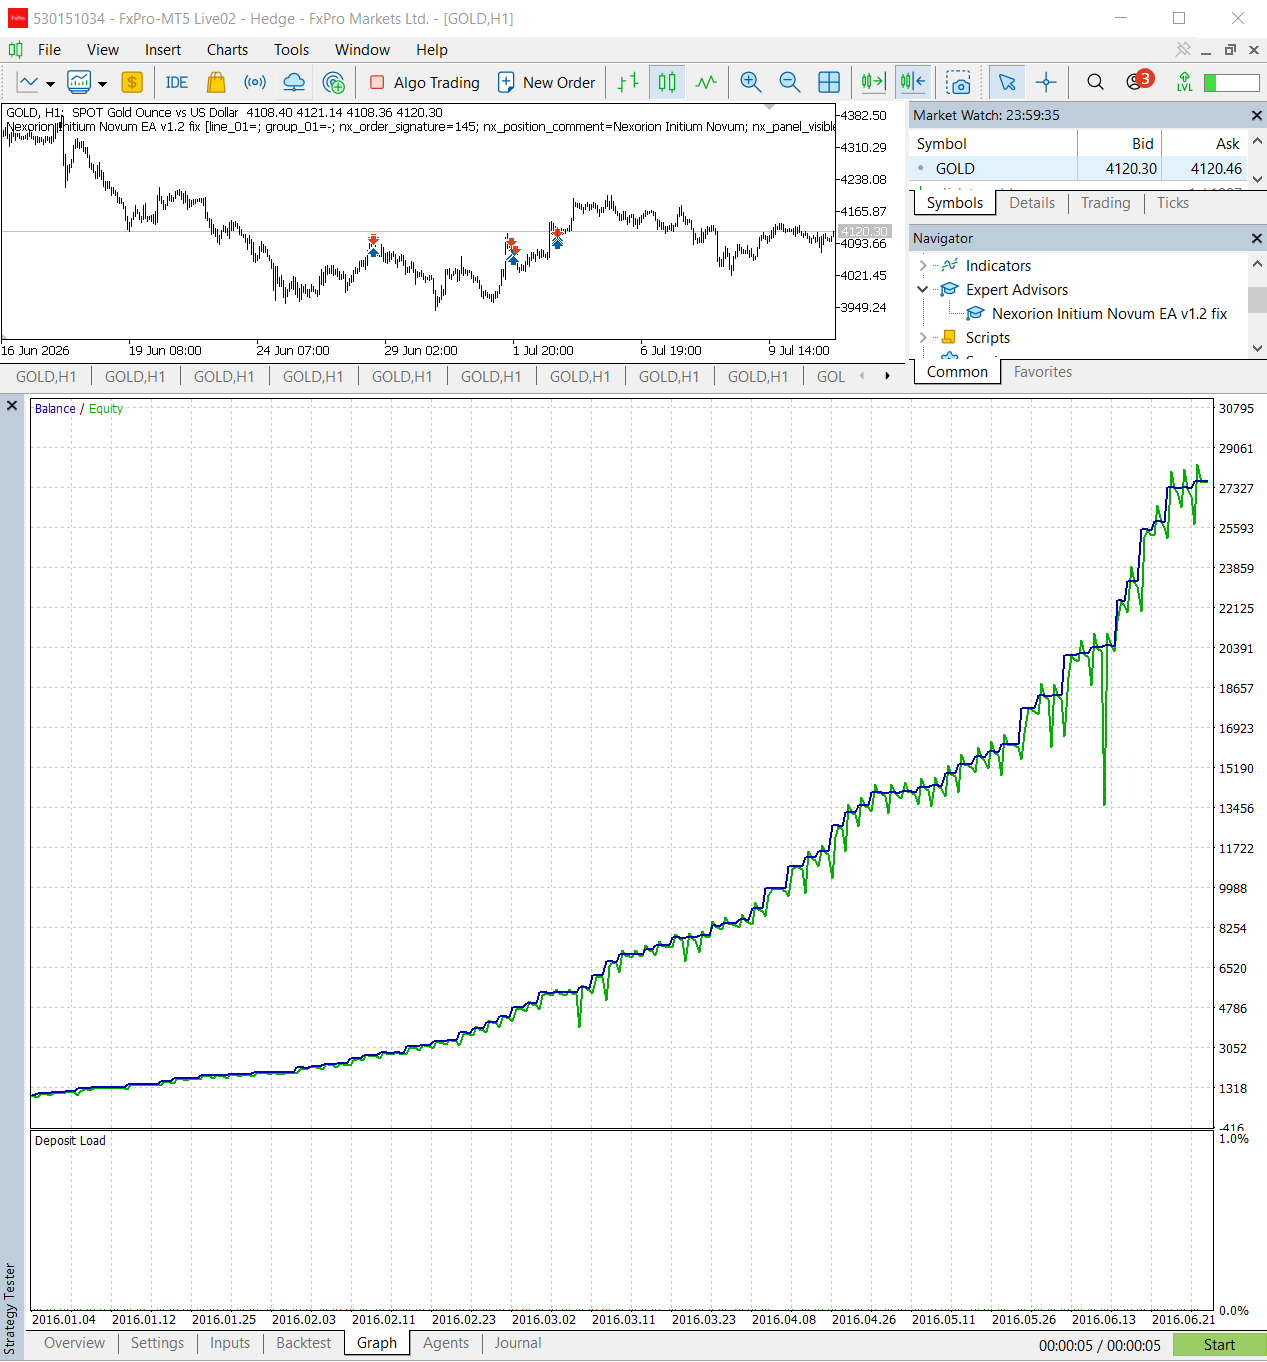
2016 Equity Curve Analysis
The 2016 test produced a positive historical balance curve and a sequence of 85 profitable trade closures.
Starting from $1,000, the account generated $26,617.42 in total net profit, representing a 2,661.74% historical return.
The reported 35.42% Relative Equity Drawdown was lower than the drawdown recorded in both 2026 tests, although it still represents meaningful floating account risk.
The key result is not simply the amount of profit. The more important observation is that the EA maintained the same 100% historical win rate under an older and structurally different Gold market period.
Original 2016 MetaTrader 5 Report
The original Strategy Tester report is included below so readers can review the historical test data directly.
Why the 2016 Test Matters
Recent-market backtests can sometimes favor Expert Advisors that have been optimized around modern volatility, spread behavior, or current market structure.
Moving the test back to 2016 provides a different environment in which to examine the EA’s behavior. The Gold market, volatility profile, and broader trading conditions were not identical to those seen in 2026.
Nexorion still maintained:
- A 100% historical win rate.
- A high Profit Factor of 28.31.
- Profitable long and short trades.
- No losing closed trades.
- A positive six-month balance curve.
This does not prove that the EA will perform consistently in every future market. It does suggest that the historical behavior was not limited exclusively to the recent 2026 test period.
Final Three-Test Comparison
The table below compares the three historical tests using the same core metrics throughout the review.
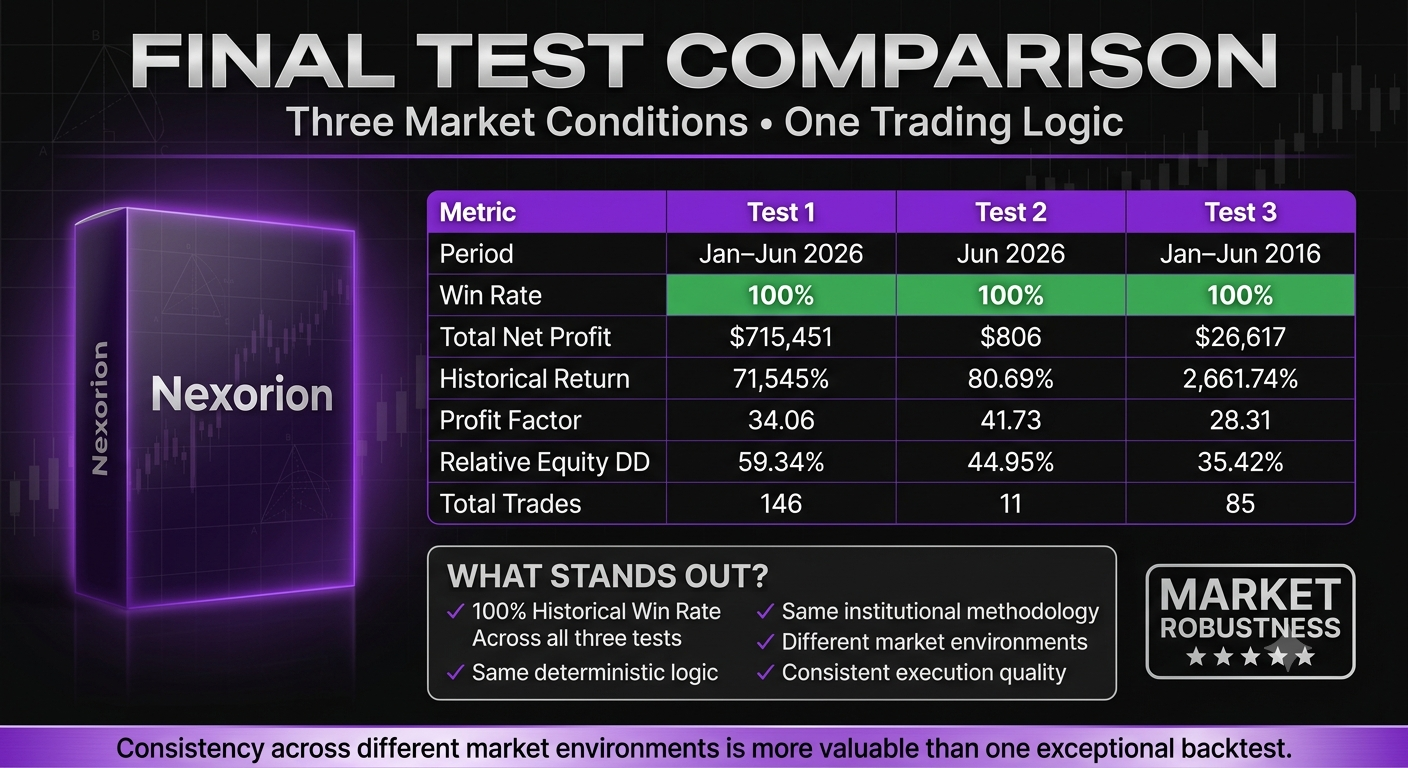
| Metric | Jan–Jun 2026 | June 2026 | Jan–Jun 2016 |
|---|---|---|---|
| Historical Win Rate | 100% | 100% | 100% |
| Total Net Profit | $715,451.44 | $806.87 | $26,617.42 |
| Historical Return | +71,545.14% | +80.69% | +2,661.74% |
| Profit Factor | 34.06 | 41.73 | 28.31 |
| Relative Equity Drawdown | 59.34% | 44.95% | 35.42% |
| Total Trades | 146 | 11 | 85 |
Consistent Findings
- 100% historical win rate in all three tests.
- No losing closed trades.
- Positive long and short trade results.
- High Profit Factor across all periods.
- Positive account growth in each test.
Variable Findings
- Total profit varied substantially by market period.
- Historical return was not consistent in size.
- Trade frequency changed across the tests.
- Relative Equity Drawdown ranged from 35.42% to 59.34%.
- Floating account risk remained significant.
Market Robustness Assessment
Strong Historical Consistency Across Three Tests
Nexorion maintained a 100% historical win rate across recent six-month data, a recent one-month validation, and an older six-month market period from 2016.
This supports the idea that the EA’s historical entry behavior was not limited to one isolated market window.
The high Relative Equity Drawdown remains the main risk consideration and prevents the 100% win rate from being interpreted as evidence of a low-risk or loss-free system.
Part 4 Takeaway
The 2016 test is the strongest evidence in this review that Nexorion’s historical behavior was not restricted to recent Gold market conditions.
Across all three tests, the EA closed every completed trade in profit while maintaining a high Profit Factor.
At the same time, Relative Equity Drawdown remained substantial in every period. This means the strategy’s consistency in closing trades profitably should always be evaluated alongside its floating risk profile.
The final section explains the underlying institutional decision process, settings, package contents, suitability, pros and cons, frequently asked questions, and the final TopTradingEAs verdict.
Three Tests. One Historical Pattern.
Nexorion maintained a perfect historical win rate across recent and older Gold market periods, while still exposing the account to significant floating equity drawdown.
View Nexorion EAHow Nexorion Makes Trading Decisions
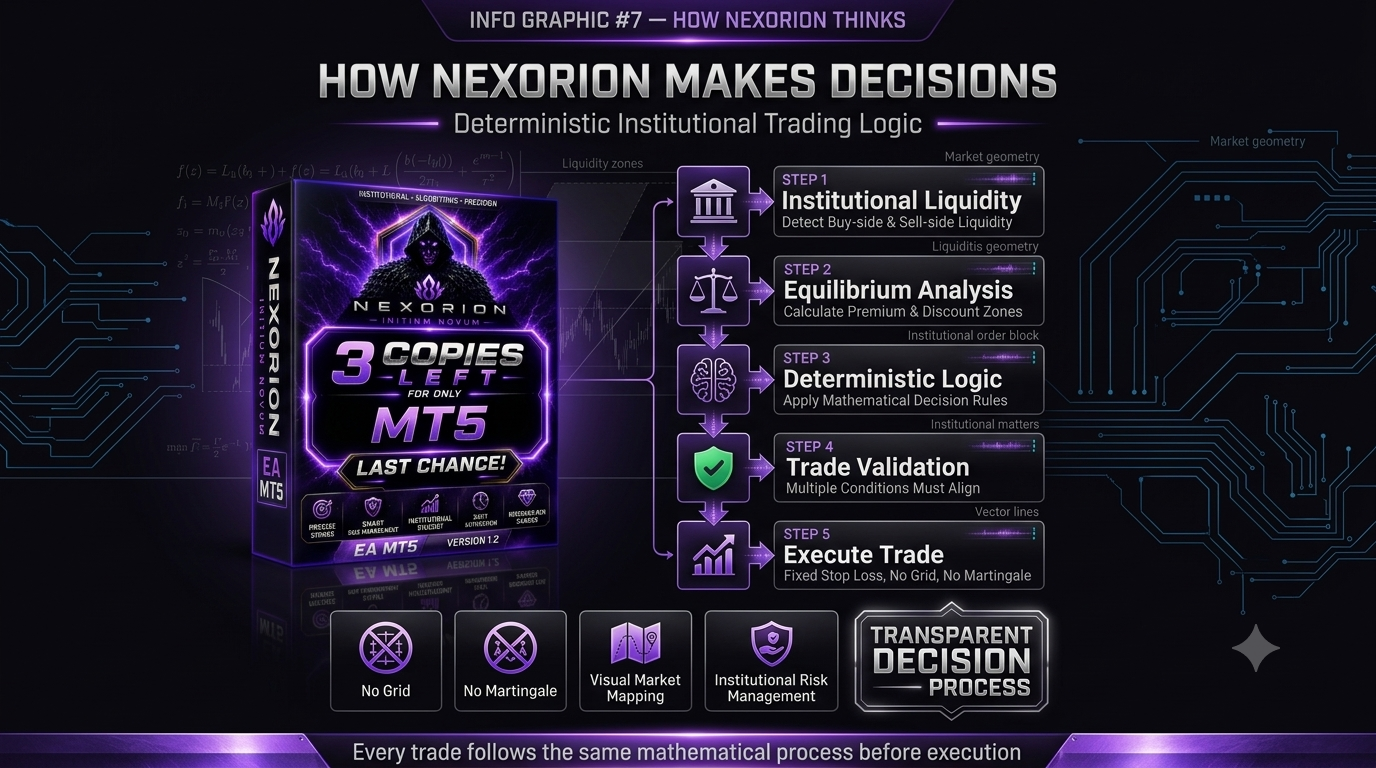
Unlike many Expert Advisors that rely primarily on traditional indicators, Nexorion attempts to build a mathematical representation of market structure before opening a position.
According to the developer, every potential trade passes through multiple analytical stages including liquidity detection, equilibrium calculation and deterministic validation before an order is executed.
The philosophy is simple:
- Identify institutional liquidity.
- Calculate market equilibrium.
- Determine Premium and Discount pricing.
- Validate multiple mathematical conditions.
- Execute only when all conditions align.
Institutional Liquidity Mapping
One feature that separates Nexorion from many conventional Gold Expert Advisors is its visual analytical interface.
Instead of simply placing trades in the background, the EA projects several elements of its market analysis directly onto the chart.
These visual components include liquidity zones, equilibrium levels and market structure information that help explain why trades are being considered.

NEXORION CORE Architecture
The EA includes what the developer calls the NEXORION CORE, an operational control interface responsible for monitoring spread conditions, liquidity scanning and execution status.
Rather than functioning as a simple buy/sell robot, the system continuously evaluates whether current market conditions satisfy the predefined mathematical requirements before allowing new positions.

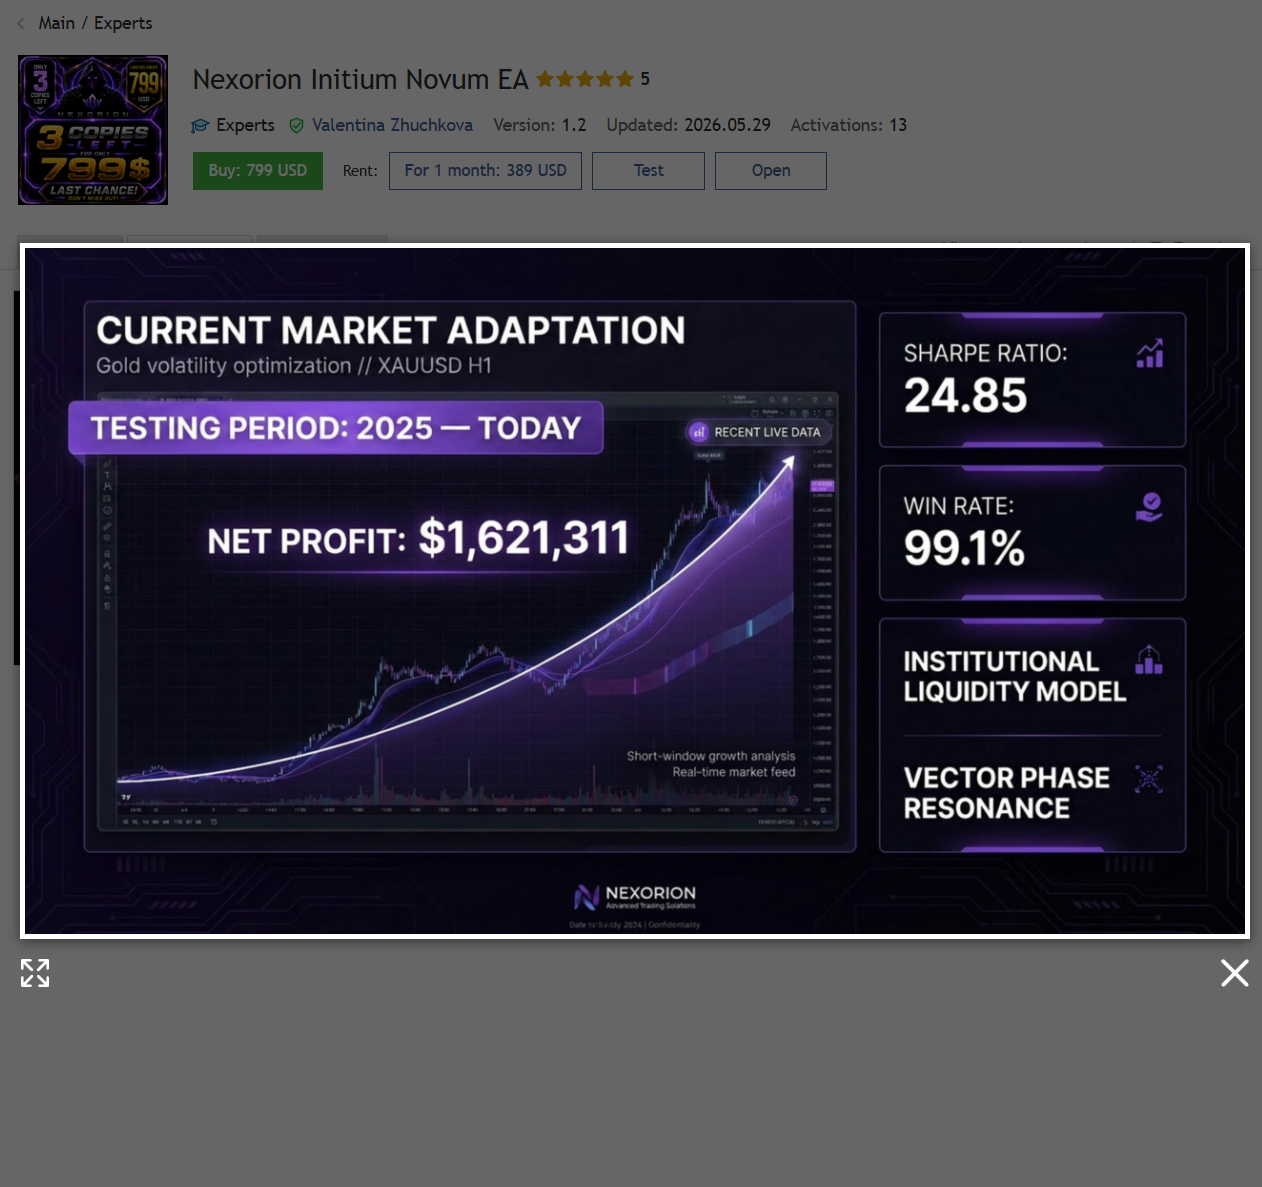
Adapting to Current Market Conditions
Financial markets constantly evolve, particularly Gold, which regularly experiences changing volatility, liquidity and macroeconomic influences.
The goal of Nexorion is not to predict every future movement but to evaluate each opportunity using the same deterministic framework regardless of market conditions.
Our historical testing across both 2026 and 2016 suggests that the strategy maintained consistent historical behaviour across different market environments, although future performance can never be guaranteed.
Recommended Trading Environment
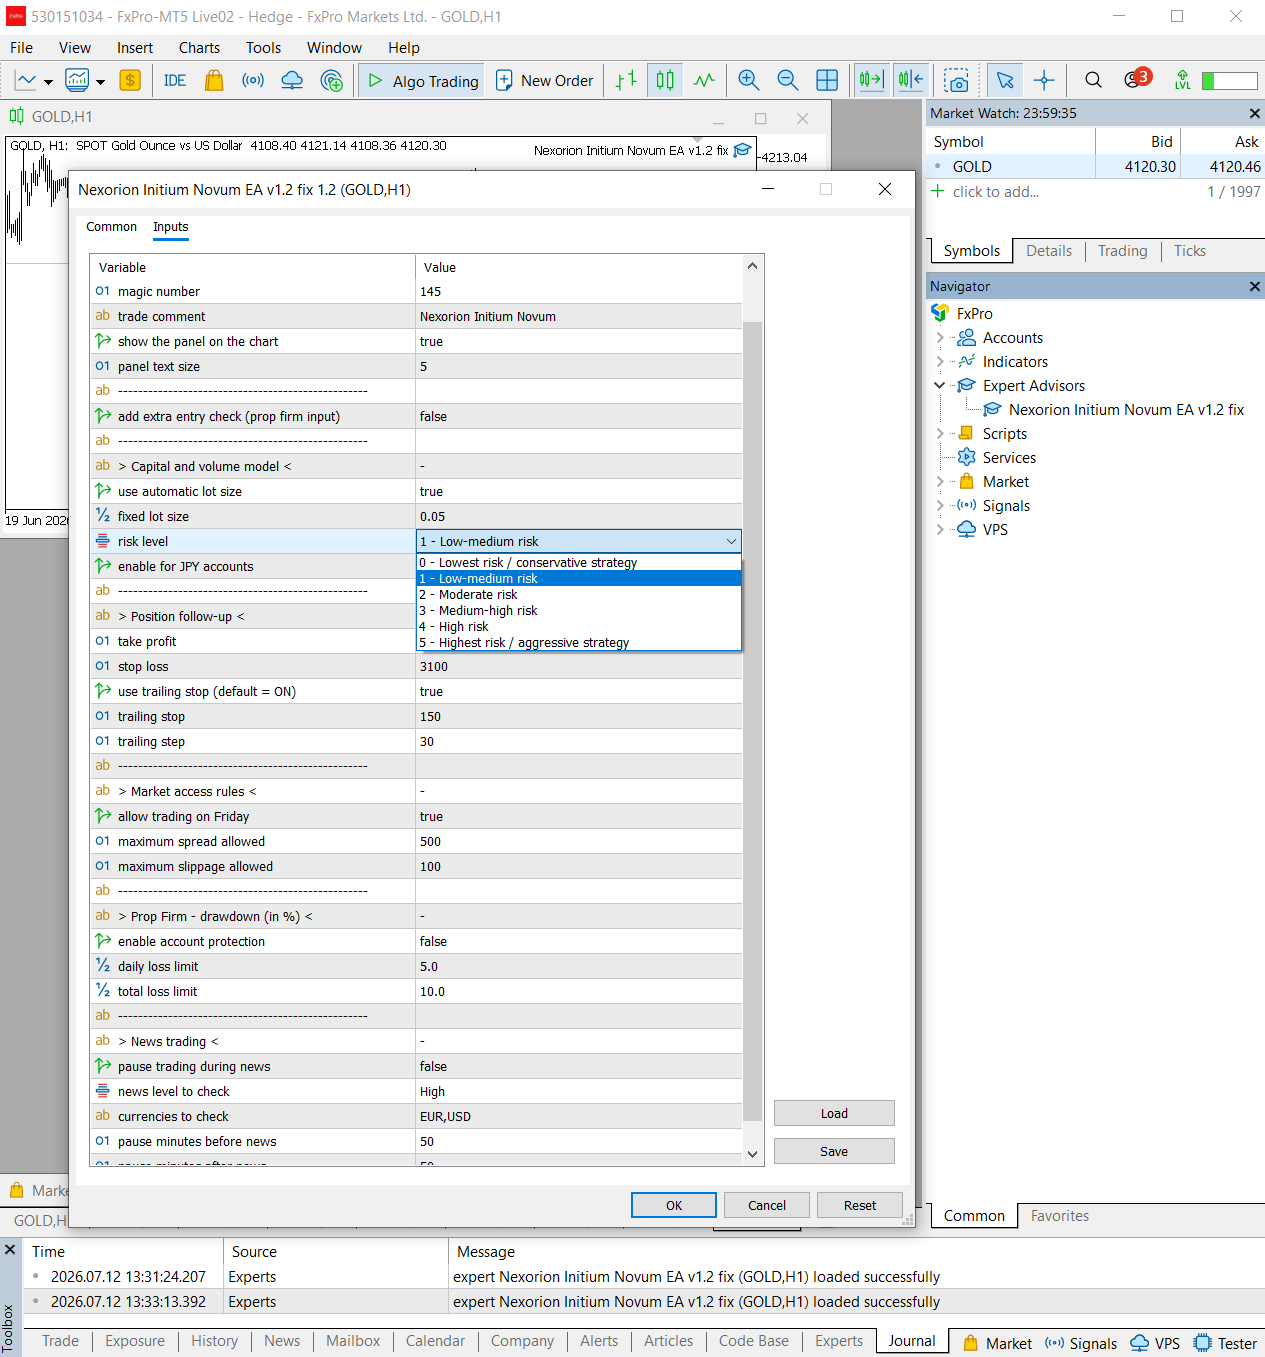
| Setting | Recommendation |
|---|---|
| Platform | MetaTrader 5 |
| Market | XAUUSD |
| Timeframe | H1 |
| Minimum Deposit | $100 |
| Recommended Deposit | $250+ |
| Broker Type | Low Spread / RAW Spread |
| VPS | Recommended |
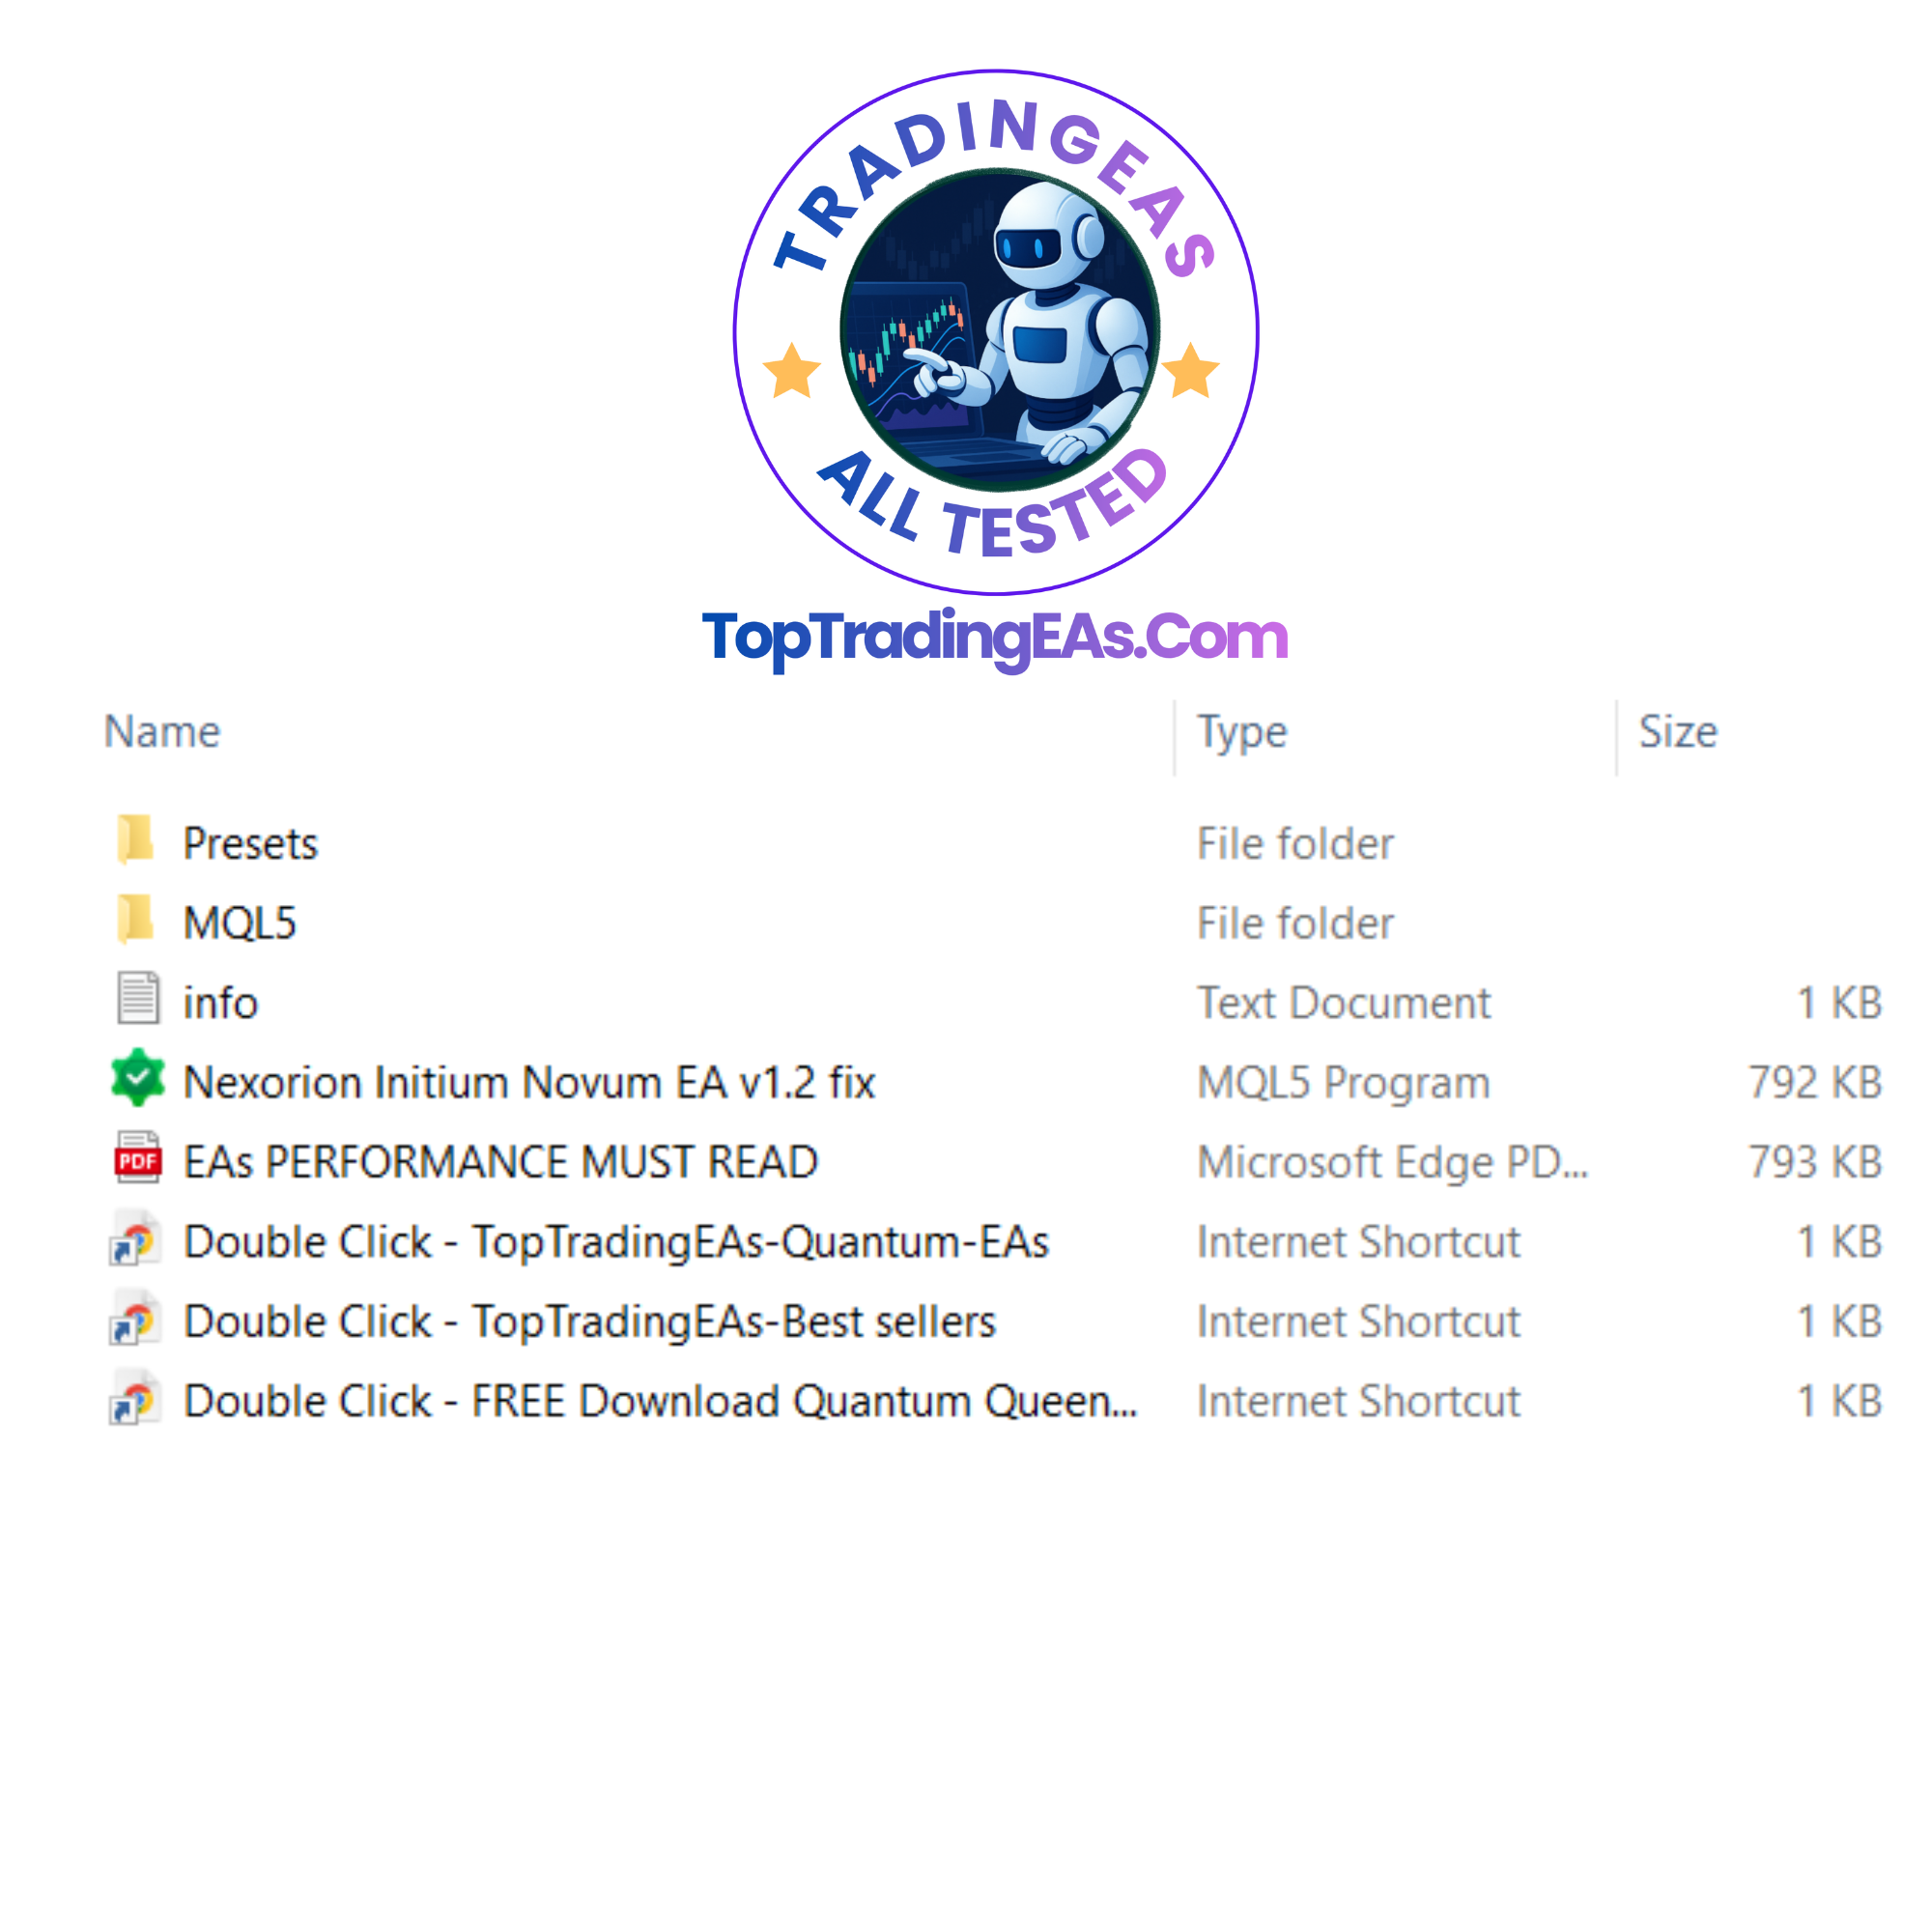
Download Package
The package supplied with Nexorion includes the Expert Advisor together with documentation and setup resources to help new users configure the system correctly.
Pros
- Institutional liquidity methodology.
- No Grid strategy.
- No Martingale recovery.
- Fixed Stop Loss on every position.
- Transparent visual market analysis.
- 100% historical win rate across all three tests.
- Strong Profit Factor.
- Consistent historical behaviour.
Cons
- Relative Equity Drawdown remained significant.
- Requires patience due to selective entries.
- Only designed for XAUUSD.
- Historical results cannot guarantee future performance.
- Broker quality and execution remain important.
Who Is Nexorion Best For?
Recommended For
- Gold traders.
- Institutional trading enthusiasts.
- Swing traders.
- Disciplined long-term traders.
- Investors who dislike Grid systems.
- Users seeking transparent strategy logic.
May Not Suit
- Scalpers seeking dozens of trades daily.
- High-frequency traders.
- Traders wanting aggressive account flipping.
- Those uncomfortable with floating drawdown.
Frequently Asked Questions
Does Nexorion use Grid or Martingale?
No. According to the developer, both Grid and Martingale techniques are excluded from the strategy.
Which market does Nexorion trade?
XAUUSD (Gold).
Which timeframe is recommended?
H1.
Can historical results guarantee future performance?
No. Historical testing is useful for evaluating behaviour under past market conditions but cannot predict future results.
What was the most impressive result in our review?
The EA maintained a 100% historical win rate across three separate historical test periods, including a six-month test using 2016 Gold market data.
Final Verdict
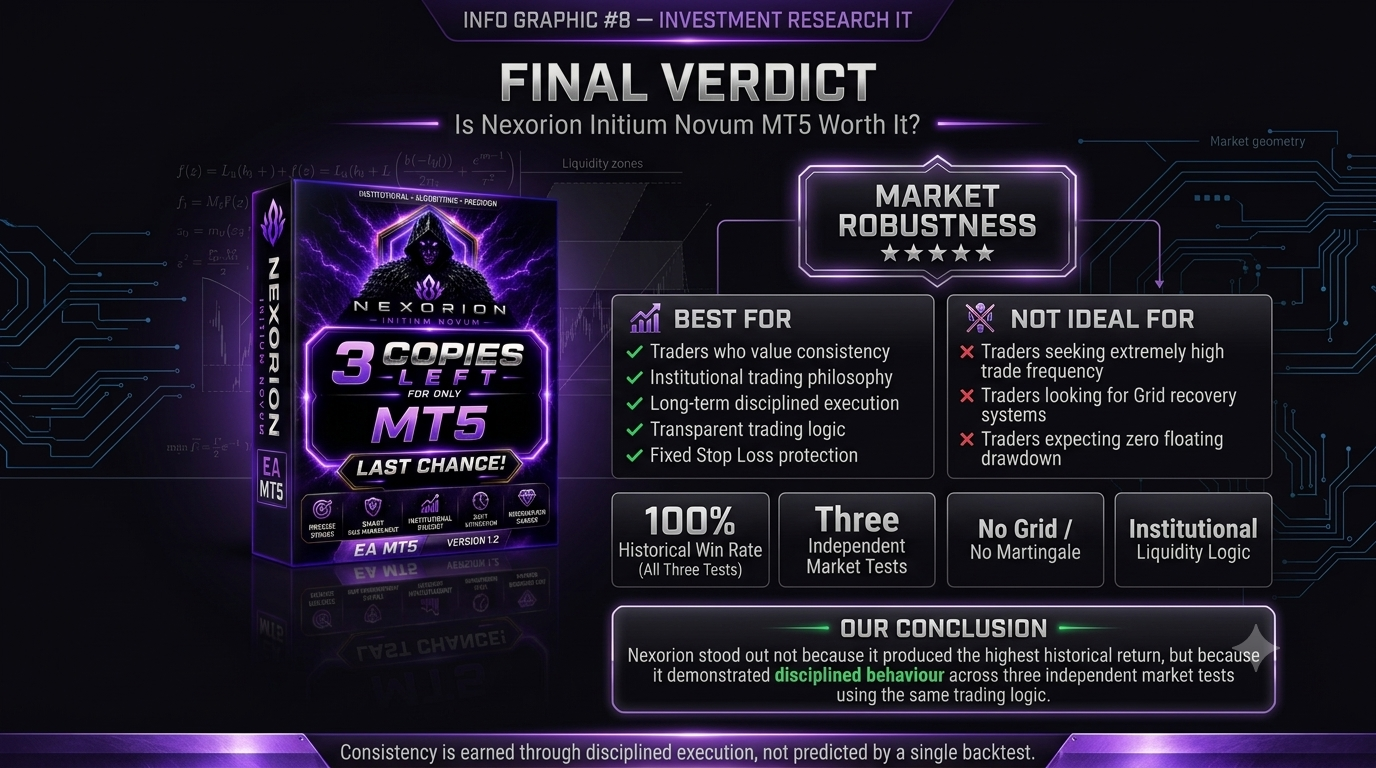
Nexorion Initium Novum EA is one of the most distinctive Gold Expert Advisors we have reviewed to date.
Instead of focusing purely on maximizing historical returns, the strategy emphasizes institutional market structure, deterministic decision making and disciplined execution.
Across three independent historical tests, the EA consistently produced a 100% historical win rate while maintaining strong Profit Factors in each period. Equally important, the review openly highlighted Relative Equity Drawdown as the primary measure of floating account risk, providing a more balanced assessment than relying solely on closed-trade statistics.
For traders seeking a transparent, structured, institutional-style approach to Gold trading rather than high-frequency Grid systems, Nexorion offers a compelling alternative. As with any automated trading strategy, proper risk management, realistic expectations and ongoing monitoring remain essential.
Download Nexorion Initium Novum EA
Ready to explore Nexorion for yourself? Visit the official product page for the latest version, setup information and download options.
Risk Disclaimer
Trading foreign exchange and CFDs involves significant risk and may not be suitable for every investor. Historical backtests and historical win rates are based on past market data and should not be interpreted as guarantees of future performance. Live trading results can differ due to spread, slippage, execution quality, broker conditions, liquidity, market volatility and user settings. Always test automated trading systems on a demo account and use responsible risk management before trading with real capital.